NOTUSDT 3DAccumulate a small bag of #NOT here and near the support zone for the mid-term. In case of a breakout above the descending resistance on the 3-day chart, the potential upside targets are:
🎯 $0.000633
🎯 $0.000822
🎯 $0.000976
🎯 $0.001129
🎯 $0.001346
🎯 $0.001624
⚠️ Always remember to use a tight stop
Notcoin update: 385%, 1000% & 1700% Profits PotentialNotcoin's (NOTUSDT) higher low and bottom recovery process has been ongoing for a full 350 days, if we go back all the way to the October 2025 flush low as the start, but this would be a bit misleading.
After the October 2025 flush, NOTUSDT continued to move within a downtrend. Lower lows based on
NOT / NOTUSDT Long Setup | Breaker Block ReclaimMARKET ANALYSIS
NOT is currently reacting from a key technical area highlighted on the chart.
As long as the protected support zone remains intact, the bullish market structure remains valid and higher liquidity targets may continue to attract price action.
A breakdown below the invalidation l
NOTUSDT Forming Falling WedgeNOTUSDT is forming a clear falling wedge pattern, a classic bullish reversal signal that often indicates a gradual drop. The price has been consolidating within a narrowing range, suggesting that selling pressure is weakening while buyers are beginning to regain control. With consistent volume confi
Notcoin: 1,000% Profits potential, bullish chart setupNOTUSDT (Notcoin) has the same chart structure from months ago, the action is happening within the same range from the February low with a bullish bias. A breakout is happening now. This is a very strong chart setup and hard to match.
There is still a huge 380% profits potential before the first ta
NOTUSDT Forming Bullish MomentumNOTUSDT is forming a clear bullish momentum pattern, a classic bullish reversal signal that often indicates an upcoming breakout. The price has been consolidating within a narrowing range, suggesting that selling pressure is weakening while buyers are beginning to regain control. With consistent vol
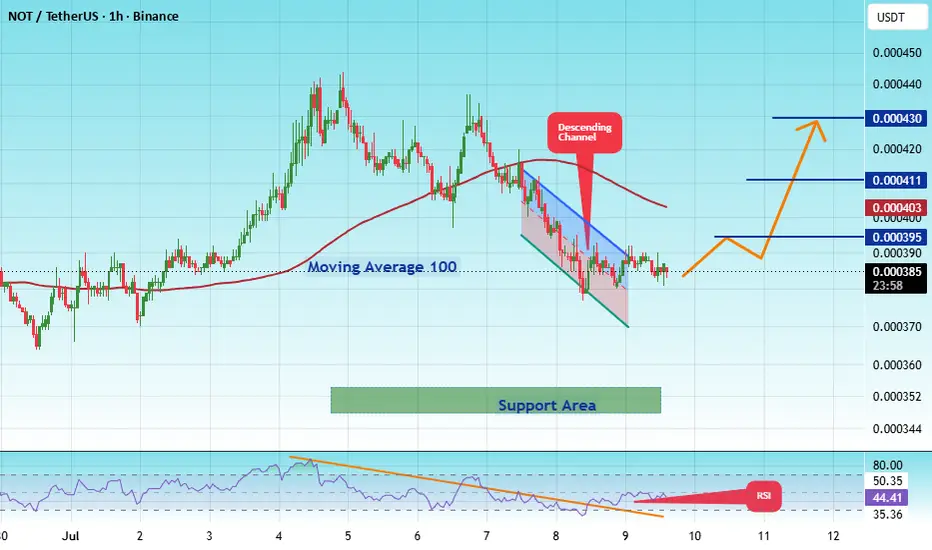
#NOTUSDT — Holding the Last Fortres, Recovery or Final Break#NOT
The price is moving within a descending channel on the 1-hour timeframe and has reached the lower boundary. It is now poised for a bounce and is expected to retest this boundary.
The Relative Strength Index (RSI) indicates a downward trend, which is likely to continue given the overbought con
NOT/USDT H2: Technical overbought condition near key🎯 TP1: $0.00040985 (+1.31%) │ TP2: $0.00040440 (+2.62%)
🛑 SL: $0.00042521 (-2.39%) │ R/R: 1 : 1.1
⚠️ SL is placed beyond the nearest candle tails to reduce the risk of accidental stop-outs.
FUNDAMENTAL BACKGROUND
NOT/USDT is moving without its own catalysts, following the broader market. The recove
NOTCOIN ($NOT): The Sleeping Giant is Waking Up! Prime Buy SetupAre you paying attention to the TON ecosystem? Because if you aren’t, you might be missing out on the next massive wave. 🌊
After a period of healthy consolidation, Notcoin (NOT/USDT) is flashing some serious bullish signals on the chart. What started as a viral Telegram game has cemented itself as
NOTUSDT - Descending Triangle Breakout or Breakdown?📊 Technical Analysis | $NOT/USDT
⏳ Time Frame: 4D
🏦 Exchange: MEXC
📐 Pattern: Descending TrendLine + Descending Triangle
🟨 Key Support Zone: $0.000385 – $0.000320
━━━━━━━━━━━━━━━━━━
🔎 📊 CHART ANALYSIS
🔻 1. 📉 Descending TrendLine
📌 XETR:NOT is still trading below the Descending TrendLine, which
See all ideas
Summarizing what the indicators are suggesting.
Oscillators
Neutral
Oscillators
Neutral
Summary
Neutral
Summary
Neutral
Summary
Neutral
Moving Averages
Neutral
Moving Averages
Neutral
Displays a symbol's price movements over previous years to identify recurring trends.