Expecting traingle pattern break outExpecting traingle pattern break out, 50 EMA retest is pending.
Stop loss below lower trendline
Target atleast 1300 then we can trail
Educational purpose only and not SEBI registered trader.
88.80INR
12.90 BINR
181.54 BINR
95.35 M
About CHOLAMANDALAM FIN
Sector
Industry
Headquarters
Chennai
Website
Employees (FY)
14.43 K
Founded
1949
ISIN
INE149A01033
FIGI
BBG000D1D025
Cholamandalam Financial Holdings Ltd. engages in the provision of investment services. It operates through the Insurance and Allied Services and Financial Services segments. The Insurance and Allied Services segment represents insurance business and related risk services. The Financial Services segment refers to financial service business. The company was founded on September 9, 1949 and is headquartered in Chennai, India.

CHOLAFINThe chart structure is good if market direction is on upside then we can have breakout here which can give good returns in short term

CHOLAHLDNGNSE:CHOLAHLDNG
One Can Enter Now !
Or Wait for Retest of the Trendline (BO) !
Or wait For better R:R ratio !
Note :
1.One Can Go long with a Strict SL below the Trendline or Swing Low.
2. R:R ratio should be 1 :2 minimum
3. Plan as per your RISK appetite and Money Management.
Disclaimer : Yo

Resistance BreakoutPlease look into the chart for a detailed understanding.
Consider these for short-term & swing trades with 2% profit.
For BTST trades consider booking
target for 1% - 2%
For long-term trades look out for resistance drawn above closing.
Please consider these ideas for educational purpose

Ascending channel breakout in CholaholdAscending channel breakout in Cholaholding
Please follow strict risk reward and stop loss
Thanks,
V Trade Point
Cholaholding view for tomorrowCholaholding view for tomorrow
Follow strict risk reward and stop loss

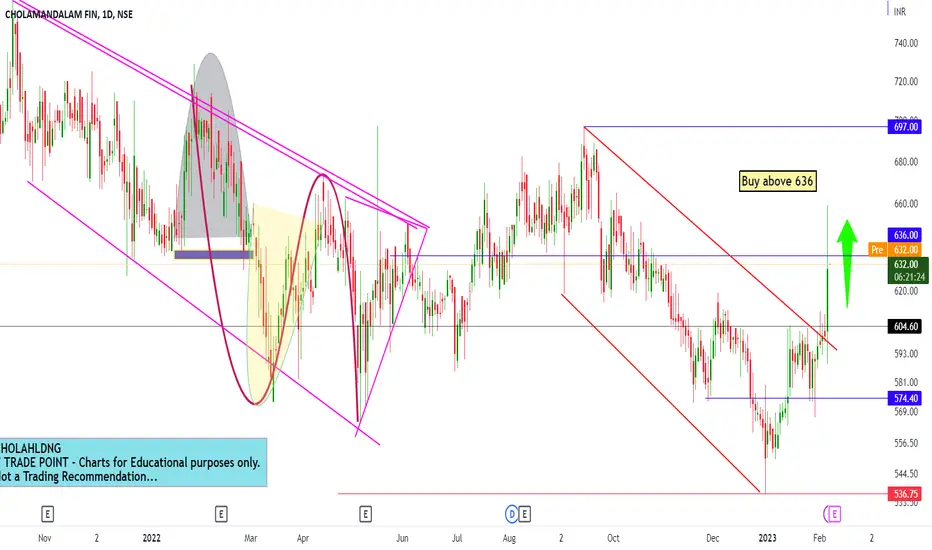
Sell below 635 SL 642 TGT 628 and 624Based on my trendline analysis. Please do your analysis before taking any trade.

breakout with good volumesStock has BO'd with good volumes..targets are not marked but you can consider 803, 1160 as targets.

cholamandlam fin hol tredline breakout and re test donecholamandlam fin hol tredline breakout and re test done good for positional by prajapati9951

fibo retracement on cholamandalam finanacebuy
as trend is sup
bounce from fibo 62% level
blending of candle 18 june and 21 june formed hammer at 62% level
sl closing below 597
tgt 724:749

See all ideas
Trade directly on the supercharts through our supported, fully-verified and user-reviewed brokers.


Frequently Asked Questions
The current price of CHOLAHLDNG is 1093.85 INR — it has decreased by 0.64% in the past 24 hours.
Depending on the exchange, the stock ticker may vary. For instance, on NSE exchange CHOLAMANDALAM FIN stocks are traded under the ticker CHOLAHLDNG.
CHOLAMANDALAM FIN is going to release the next earnings report on May 10, 2024. Keep track of upcoming events with our Earnings Calendar.
CHOLAHLDNG stock is 2.82% volatile and has beta coefficient of 0.96. Check out the list of the most volatile stocks — is CHOLAMANDALAM FIN there?
Yes, you can track CHOLAMANDALAM FIN financials in yearly and quarterly reports right on TradingView.
CHOLAHLDNG stock has risen by 3.10% compared to the previous week, the month change is a 0.97% rise, over the last year CHOLAMANDALAM FIN has showed a 89.33% increase.
CHOLAHLDNG net income for the last quarter is 4.67 B INR, while the quarter before that showed 4.21 B INR of net income which accounts for 10.98% change. Track more CHOLAMANDALAM FIN financial stats to get the full picture.
Today CHOLAMANDALAM FIN has the market capitalization of 206.85 B, it has decreased by 0.42% over the last week.
Yes, CHOLAHLDNG dividends are paid annually. The last dividend per share was 0.55 INR. As of today, Dividend Yield (TTM)% is 0.05%. Tracking CHOLAMANDALAM FIN dividends might help you take more informed decisions.
CHOLAMANDALAM FIN dividend yield was 0.10% in 2022, and payout ratio reached 0.80%. The year before the numbers were 0.09% and 1.01% correspondingly. See high-dividend stocks and find more opportunities for your portfolio.
Like other stocks, CHOLAHLDNG shares are traded on stock exchanges, e.g. Nasdaq, Nyse, Euronext, and the easiest way to buy them is through an online stock broker. To do this, you need to open an account and follow a broker's procedures, then start trading. You can trade CHOLAMANDALAM FIN stock right from TradingView charts — choose your broker and connect to your account.
As of Apr 25, 2024, the company has 14.43 K employees. See our rating of the largest employees — is CHOLAMANDALAM FIN on this list?
Investing in stocks requires a comprehensive research: you should carefully study all the available data, e.g. company's financials, related news, and its technical analysis. So CHOLAMANDALAM FIN technincal analysis shows the buy rating today, and its 1 week rating is strong buy. Since market conditions are prone to changes, it's worth looking a bit further into the future — according to the 1 month rating CHOLAMANDALAM FIN stock shows the buy signal. See more of CHOLAMANDALAM FIN technicals for a more comprehensive analysis.
If you're still not sure, try looking for inspiration in our curated watchlists.
If you're still not sure, try looking for inspiration in our curated watchlists.
We've gathered analysts' opinions on CHOLAMANDALAM FIN future price: according to them, CHOLAHLDNG price has a max estimate of 1425.00 INR and a min estimate of 1300.00 INR. Read a more detailed CHOLAMANDALAM FIN forecast: see what analysts think of CHOLAMANDALAM FIN and suggest that you do with its stocks.
EBITDA measures a company's operating performance, its growth signifies an improvement in the efficiency of a company. CHOLAMANDALAM FIN EBITDA is 63.04 B INR, and current EBITDA margin is 58.76%. See more stats in CHOLAMANDALAM FIN financial statements.