6.75INR
611.70 MINR
16.86 BINR
42.71 M
About S H KELKAR AND COM
Sector
CEO
Kedar Ramesh Vaze
Headquarters
Mumbai
Website
Employees (FY)
840
Founded
1922
ISIN
INE500L01026
FIGI
BBG00B5ZQZ33
S.H. Kelkar & Co Ltd. is a holding company, which engages in the manufacture and sale of fragrances and flavours. It operates through two segments: Fragrance and Flavour. The Fragrance segment sells fragrances and aroma ingredients as a raw material in personal wash fabric care, skin and hair care, air care, fine fragrances, and household products. The Flavour segment focuses on flavours that are used as a raw materials by producers of baked goods, dairy products, confectionery, savoury, beverages, and pharmaceutical products. The company was founded in 1922 and is headquartered in Mumbai, India.


SHK - LongSHK is trading near resistance, crossing this resistance will change the trend on longer time scale.
good volume build up.

Multiyear BreakoutAfter 7 years of down trend finally price break the multiyear resistance and price ready to touch its life high because larger the consolidations stronger the move . Previous weekly swing low act as a exit point .

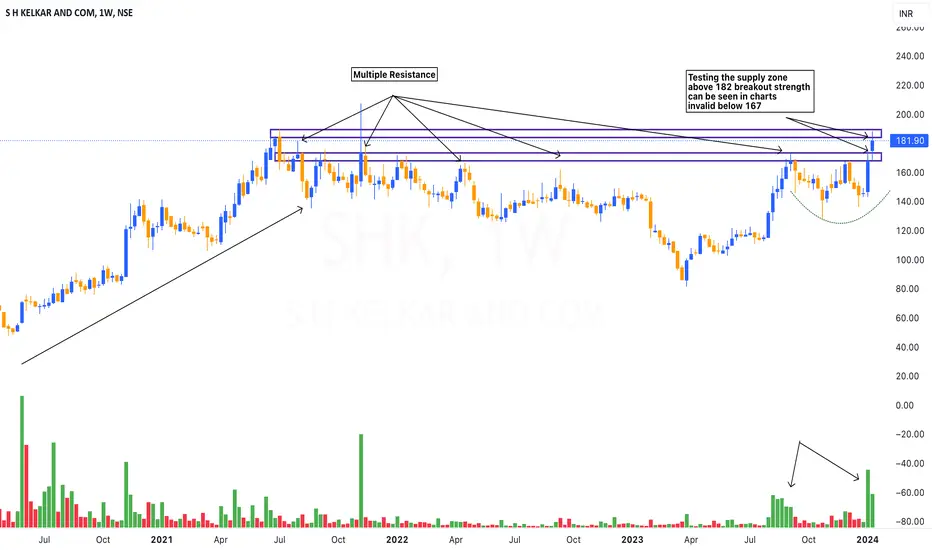
S H KELKAR APPROACHING BREAKOUT ZONES H KELKAR AND COM is approaching towards the breakout zone.
above the level of 182 it can show the strength.
levels marked on the chart
volume spurt in last two weeks
Sh Kelkar bullish flag pattern daily and weekly BOSh Kelkar bullish flag pattern daily and weekly BO with huge volumes build up for swing target of 187 and 219.

SHKSHK
Gave breakout of inside bar.With strong volume.Looks good for swing trade.
Trading at at 161
Keep sl at 145
Target can be
210
Disclaimer :- script disscussed only for education purpose. It is not any recommendation to buy or sell. You will be fully responsible for your profit and losses

S H Kelkar - BreakoutAnother interesting technical chart..
The stock has shot back above the 200EMA and also broken out above the diagonal trendline resistance.
Long at current price 148.50 with Stoploss below 141.

S H K flag pattern SHK flag pattern lets see can price make more rally or rejected from these levels


See all ideas
Trade directly on the supercharts through our supported, fully-verified and user-reviewed brokers.


Frequently Asked Questions
The current price of SHK is 199.40 INR — it has decreased by 1.29% in the past 24 hours.
Depending on the exchange, the stock ticker may vary. For instance, on NSE exchange S H KELKAR AND COM stocks are traded under the ticker SHK.
S H KELKAR AND COM is going to release the next earnings report on May 29, 2024. Keep track of upcoming events with our Earnings Calendar.
SHK stock is 2.80% volatile and has beta coefficient of −0.27. Check out the list of the most volatile stocks — is S H KELKAR AND COM there?
SHK earnings for the last quarter are 1.60 INR whereas the estimation was 1.60 INR which accounts for 0% surprise. Estimated earnings for the next quarter are 1.70 INR. See more details about S H KELKAR AND COM earnings.
S H KELKAR AND COM revenue for the last quarter amounts to 4.15 B INR despite the estimated figure of 4.15 B INR. In the next quarter revenue is expected to reach 4.14 B INR.
Yes, you can track S H KELKAR AND COM financials in yearly and quarterly reports right on TradingView.
SHK stock has fallen by 6.60% compared to the previous week, the month change is a 8.72% rise, over the last year S H KELKAR AND COM has showed a 78.51% increase.
SHK net income for the last quarter is 321.70 M INR, while the quarter before that showed 293.20 M INR of net income which accounts for 9.72% change. Track more S H KELKAR AND COM financial stats to get the full picture.
Today S H KELKAR AND COM has the market capitalization of 28.22 B, it has decreased by 2.19% over the last week.
S H KELKAR AND COM dividend yield was 2.01% in 2022, and payout ratio reached 44.20%. The year before the numbers were 0.52% and 6.94% correspondingly. See high-dividend stocks and find more opportunities for your portfolio.
Like other stocks, SHK shares are traded on stock exchanges, e.g. Nasdaq, Nyse, Euronext, and the easiest way to buy them is through an online stock broker. To do this, you need to open an account and follow a broker's procedures, then start trading. You can trade S H KELKAR AND COM stock right from TradingView charts — choose your broker and connect to your account.
As of Apr 19, 2024, the company has 840.00 employees. See our rating of the largest employees — is S H KELKAR AND COM on this list?
Investing in stocks requires a comprehensive research: you should carefully study all the available data, e.g. company's financials, related news, and its technical analysis. So S H KELKAR AND COM technincal analysis shows the sell today, and its 1 week rating is buy. Since market conditions are prone to changes, it's worth looking a bit further into the future — according to the 1 month rating S H KELKAR AND COM stock shows the buy signal. See more of S H KELKAR AND COM technicals for a more comprehensive analysis.
If you're still not sure, try looking for inspiration in our curated watchlists.
If you're still not sure, try looking for inspiration in our curated watchlists.
EBITDA measures a company's operating performance, its growth signifies an improvement in the efficiency of a company. S H KELKAR AND COM EBITDA is 2.86 B INR, and current EBITDA margin is 12.90%. See more stats in S H KELKAR AND COM financial statements.