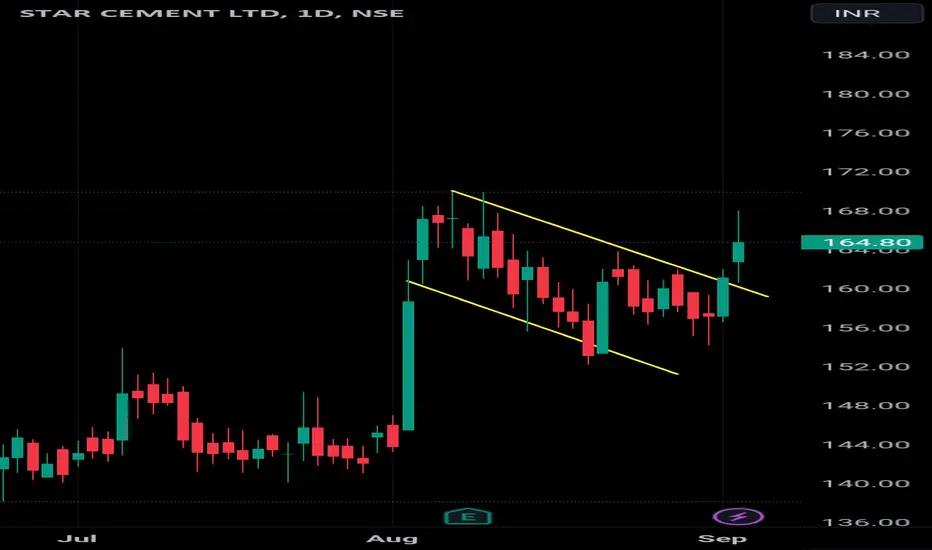
Star Cement Ltd. engages in the manufacture and sale of cement. Its products include ordinary portland, OPC 53-Grade, portland pozzolana, portland slag, and anti rust cement. The company was founded on February 11, 2001 and is headquartered in Kolkata, India.
The current price of STARCEMENT is 226.25 INR — it has decreased by 2.16% in the past 24 hours.
Depending on the exchange, the stock ticker may vary. For instance, on NSE exchange STAR CEMENT LTD stocks are traded under the ticker STARCEMENT.
STAR CEMENT LTD is going to release the next earnings report on Apr 30, 2024. Keep track of upcoming events with our Earnings Calendar.
STARCEMENT stock is 3.71% volatile and has beta coefficient of 0.73. Check out the list of the most volatile stocks — is STAR CEMENT LTD there?
STARCEMENT earnings for the last quarter are 1.00 INR per share, whereas the estimation was 1.20 INR resulting in a −16.67% surprise. The estimated earnings for the next quarter are 1.60 INR per share. See more details about STAR CEMENT LTD earnings.
STAR CEMENT LTD revenue for the last quarter amounts to 5.85 B INR despite the estimated figure of 6.15 B INR. In the next quarter revenue is expected to reach 6.48 B INR.
STARCEMENT stock has risen by 2.84% compared to the previous week, the month change is a 7.66% rise, over the last year STAR CEMENT LTD has showed a 103.83% increase.
STARCEMENT net income for the last quarter is 735.19 M INR, while the quarter before that showed 406.70 M INR of net income which accounts for 80.77% change. Track more STAR CEMENT LTD financial stats to get the full picture.
Today STAR CEMENT LTD has the market capitalization of 93.39 B, it has decreased by 0.13% over the last week.
STAR CEMENT LTD dividend yield was 0% in 2022, and payout ratio reached 0%. The year before the numbers were 0% and 0% correspondingly. See high-dividend stocks and find more opportunities for your portfolio.
Like other stocks, STARCEMENT shares are traded on stock exchanges, e.g. Nasdaq, Nyse, Euronext, and the easiest way to buy them is through an online stock broker. To do this, you need to open an account and follow a broker's procedures, then start trading. You can trade STAR CEMENT LTD stock right from TradingView charts — choose your broker and connect to your account.
STARCEMENT reached its all-time high on Mar 27, 2024 with the price of 241.70 INR, and its all-time low was 60.00 INR and was reached on Mar 19, 2020. See other stocks reaching their highest and lowest prices.
As of Apr 23, 2024, the company has 2.42 K employees. See our rating of the largest employees — is STAR CEMENT LTD on this list?
Investing in stocks requires a comprehensive research: you should carefully study all the available data, e.g. company's financials, related news, and its technical analysis. So STAR CEMENT LTD technincal analysis shows the buy rating today, and its 1 week rating is buy. Since market conditions are prone to changes, it's worth looking a bit further into the future — according to the 1 month rating STAR CEMENT LTD stock shows the buy signal. See more of STAR CEMENT LTD technicals for a more comprehensive analysis. If you're still not sure, try looking for inspiration in our curated watchlists.
We've gathered analysts' opinions on STAR CEMENT LTD future price: according to them, STARCEMENT price has a max estimate of 271.00 INR and a min estimate of 94.00 INR. Read a more detailed STAR CEMENT LTD forecast: see what analysts think of STAR CEMENT LTD and suggest that you do with its stocks.
EBITDA measures a company's operating performance, its growth signifies an improvement in the efficiency of a company. STAR CEMENT LTD EBITDA is 5.43 B INR, and current EBITDA margin is 13.98%. See more stats in STAR CEMENT LTD financial statements.