

12.80INR
105.74 BINR
1.49 TINR
1.26 B
About VEDANTA LTD
Sector
Industry
Headquarters
Mumbai
Website
Employees (FY)
87.51 K
Founded
1965
ISIN
INE205A01025
FIGI
BBG000CZGB60
Vedanta Ltd. is a natural resource company, which engages in the exploration, extraction, and processing of minerals, oil, and gas properties. It operates through the following segments: Copper, Aluminum, Iron Ore, Power, and Oil & Gas. The Copper segment focuses in custom smelting and also include a copper smelter, a refinery, a phosphoric acid plant, a sulphuric acid plant, a copper rod plant, and three captive power plants. The Aluminum segment comprises refinery and a captive power plant at Lanjigarh and a smelter, a thermal coal based captive power facility at Jharsuguda both situated in the State of Odisha in India. The Iron Ore segment explores, mines, and processes iron ore, pig iron, and metallurgical coke. The Power segment consists 600 MW thermal coal-based commercial power facility at Jharsuguda in the State of Odisha in Eastern India. The Oil and Gas segment involves in the exploration and development and production of oil and gas. The company was founded by Dwarka Prasad Agarwal on June 25, 1965 and is headquartered in Mumbai, India.

Vedantha has potential to break all time high in this yearVedantha:-
Sector:-metal-non-ferrous
monthly chart:-formation of Ascending Triangle and Double Bottom Pattern.

$NSE:VEDL VEDANTA FOR LONG BUY TOP TO DOWN ANALYSISNSE:VEDL Vedanta looks promising and ready for upmove, Cosidering the global scenario and the rise for demand in copper and semiconductors. Vedanta stood strong and our charts also shows a leg up trajectory.
VEDANTA chart have successfully bounced from 0.618 Fibonacci forming a double bottom patter

VEDANTA cmp 257, target of 300 ++ in 10-15 trading sessionsVedanta Ltd is a diversified natural resource group engaged in exploring, extracting and processing minerals and oil & gas. The group engages in the exploration, production and sale of zinc, lead, silver, copper, aluminium, iron ore and oil & gas. It has presence across India, South Africa, Namibia,

VEDL Perfect breakout set up?VEDL has crossed the resistance with a strong candle and this move is supported by volume as well. It might move to target marked in some time.
Stochastic has changed its direction, and started moving up. It can also be an added confirmation of a positional buying setup/ investment.
Simple charts,

VEDL - BULLISH Stock name - Vedanta Limited.
✅#VEDANTA trading above Resistance of 358.
✅Next Resistance is at 430.
✅Moved 40% in 18 weeks.
Weekly chart setup
Chart is self explanatory. Levels of breakout, possible up-moves (where stock may find resistances) and support (close below which, setup will be invalidate

Vedanta best buy for investment Hello frds,
Vedanta is now @ 264 Rs
Target 300 / 407/ 508
best investment idea.
stop loss 235 Rs
Note this idea for education study purpose only.


Vedanta breakout of the range & resistance with good volumecan be a good in this bull run market which stock was in under perform.
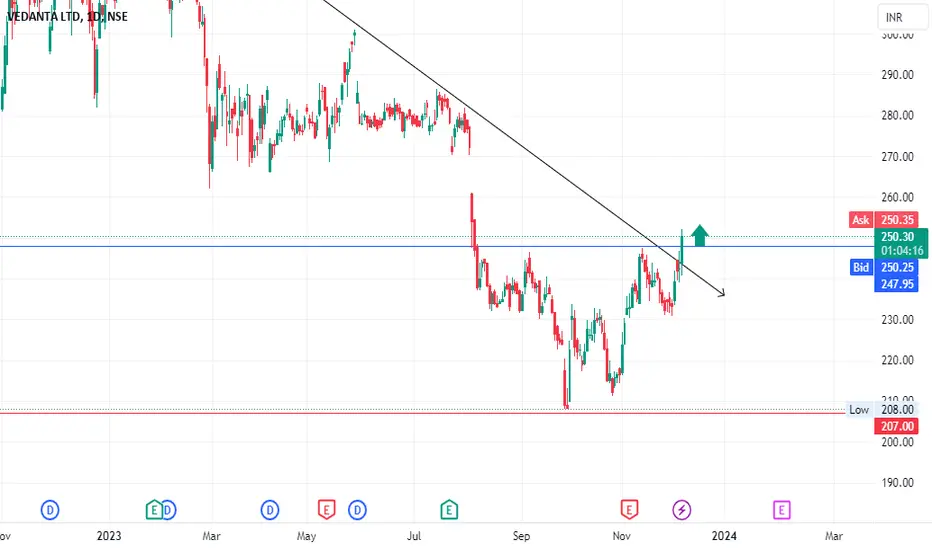
VEDL - Bullish Chart SetupStock name - Vedanta Limited.
✅#VEDL trading above Resistance of 244.
✅Next Resistance is at 284.
✅Moved 24% in 16 weeks.
Weekly chart setup
Chart is self explanatory. Levels of breakout, possible up-moves (where stock may find resistances) and support (close below which, setup will be invalidated)

See all ideas
Trade directly on the supercharts through our supported, fully-verified and user-reviewed brokers.


Curated watchlists where VEDL is featured.

Frequently Asked Questions
The current price of VEDL is 383.45 INR — it has increased by 1.70% in the past 24 hours.
Depending on the exchange, the stock ticker may vary. For instance, on NSE exchange VEDANTA LTD stocks are traded under the ticker VEDL.
VEDANTA LTD is going to release the next earnings report on May 9, 2024. Keep track of upcoming events with our Earnings Calendar.
VEDL stock is 2.82% volatile and has beta coefficient of 1.12. Check out the list of the most volatile stocks — is VEDANTA LTD there?
VEDL earnings for the last quarter are −4.80 INR per share, whereas the estimation was 2.70 INR resulting in a −277.78% surprise. The estimated earnings for the next quarter are 3.00 INR per share. See more details about VEDANTA LTD earnings.
VEDANTA LTD revenue for the last quarter amounts to 385.46 B INR despite the estimated figure of 331.10 B INR. In the next quarter revenue is expected to reach 345.16 B INR.
Yes, you can track VEDANTA LTD financials in yearly and quarterly reports right on TradingView.
VEDL stock has risen by 3.61% compared to the previous week, the month change is a 40.46% rise, over the last year VEDANTA LTD has showed a 38.98% increase.
VEDL net income for the last quarter is 20.13 B INR, while the quarter before that showed −17.83 B INR of net income which accounts for 212.90% change. Track more VEDANTA LTD financial stats to get the full picture.
Today VEDANTA LTD has the market capitalization of 1.40 T, it has increased by 0.73% over the last week.
VEDANTA LTD dividend yield was 36.95% in 2022, and payout ratio reached 356.10%. The year before the numbers were 11.15% and 88.71% correspondingly. See high-dividend stocks and find more opportunities for your portfolio.
Like other stocks, VEDL shares are traded on stock exchanges, e.g. Nasdaq, Nyse, Euronext, and the easiest way to buy them is through an online stock broker. To do this, you need to open an account and follow a broker's procedures, then start trading. You can trade VEDANTA LTD stock right from TradingView charts — choose your broker and connect to your account.
As of Apr 24, 2024, the company has 87.51 K employees. See our rating of the largest employees — is VEDANTA LTD on this list?
Investing in stocks requires a comprehensive research: you should carefully study all the available data, e.g. company's financials, related news, and its technical analysis. So VEDANTA LTD technincal analysis shows the buy rating today, and its 1 week rating is buy. Since market conditions are prone to changes, it's worth looking a bit further into the future — according to the 1 month rating VEDANTA LTD stock shows the strong buy signal. See more of VEDANTA LTD technicals for a more comprehensive analysis.
If you're still not sure, try looking for inspiration in our curated watchlists.
If you're still not sure, try looking for inspiration in our curated watchlists.
We've gathered analysts' opinions on VEDANTA LTD future price: according to them, VEDL price has a max estimate of 394.00 INR and a min estimate of 255.00 INR. Read a more detailed VEDANTA LTD forecast: see what analysts think of VEDANTA LTD and suggest that you do with its stocks.
EBITDA measures a company's operating performance, its growth signifies an improvement in the efficiency of a company. VEDANTA LTD EBITDA is 357.71 B INR, and current EBITDA margin is 24.82%. See more stats in VEDANTA LTD financial statements.