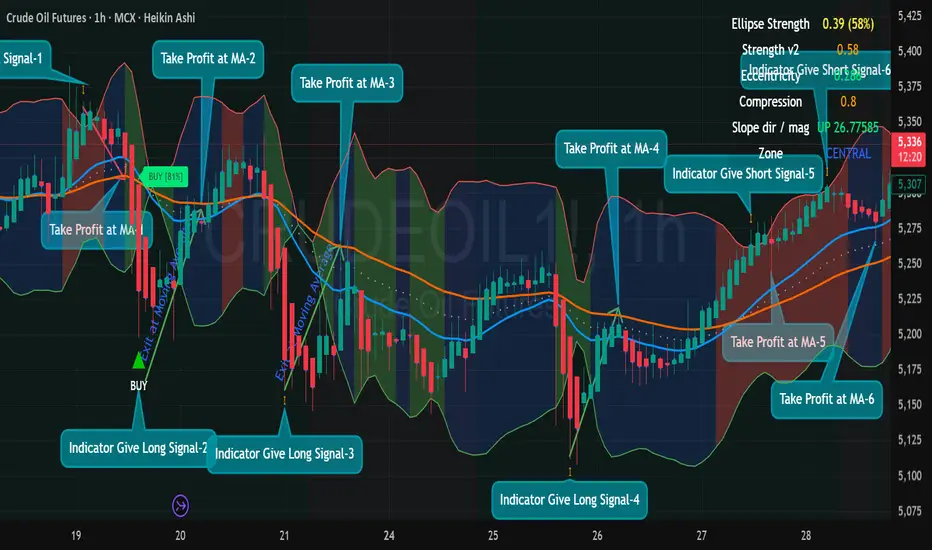
6 Back-to-Back Winning Trades Using Ellipse Price Action.6 Back-to-Back Winning Trades Using Ellipse Price Action Indicator (Crude Oil · 1H)
Ellipse Price Action Indicator captured 6 clean winning entries on MCX Crude Oil (1-Hour).
The system is simple:
✔ Indicator gives Buy/Sell Signal (Green/Red Triangle or Orange Arrow)
✔ Take entry only when price
Related commodities
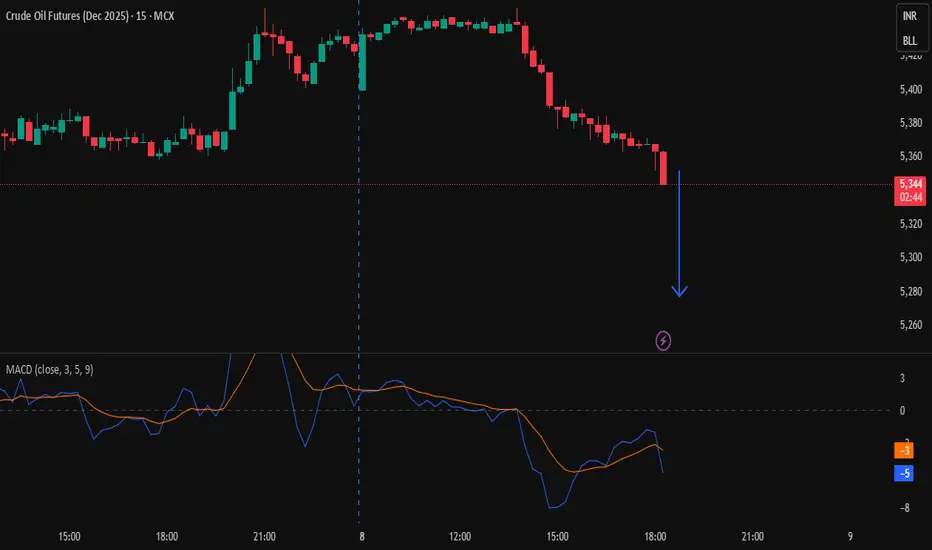
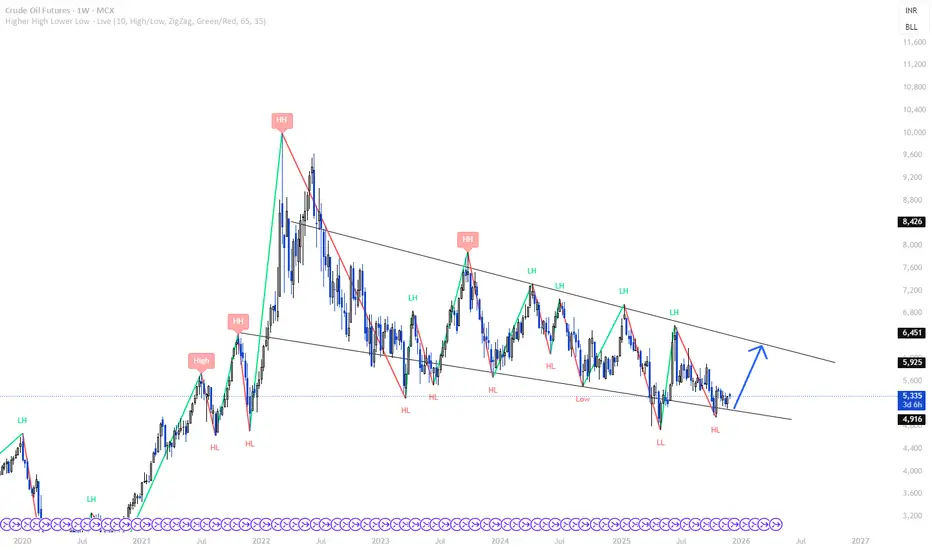
CRUDEOIL DEC 2025 FUTURESPrice making lower low and MACD making higher high and also MACD line if crosses below signal line, I thinks its going to be huge
CRUDE OILDO YOU KNOW WHATS BEHIND THIS OR OTHER IDEAS?? in bio..
Preferably suitable for scalping and accurate as long as you watch carefully the price action with the drawn areas.
With your likes and comments, you give me enough energy to provide the best analysis on an ongoing basis.
And if you needed any

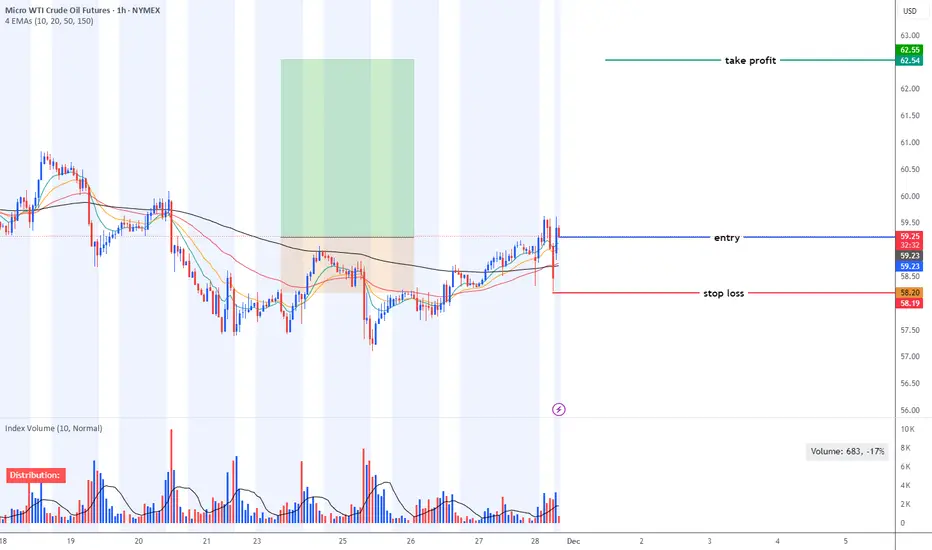
MCL - swing trade opportunity based on technical analysisMCL - swing trade opportunity based on technical analysis.
CRUDE OILDO YOU KNOW WHATS BEHIND THIS OR OTHER IDEAS?? in bio..
Preferably suitable for scalping and accurate as long as you watch carefully the price action with the drawn areas.
With your likes and comments, you give me enough energy to provide the best analysis on an ongoing basis.
And if you needed any

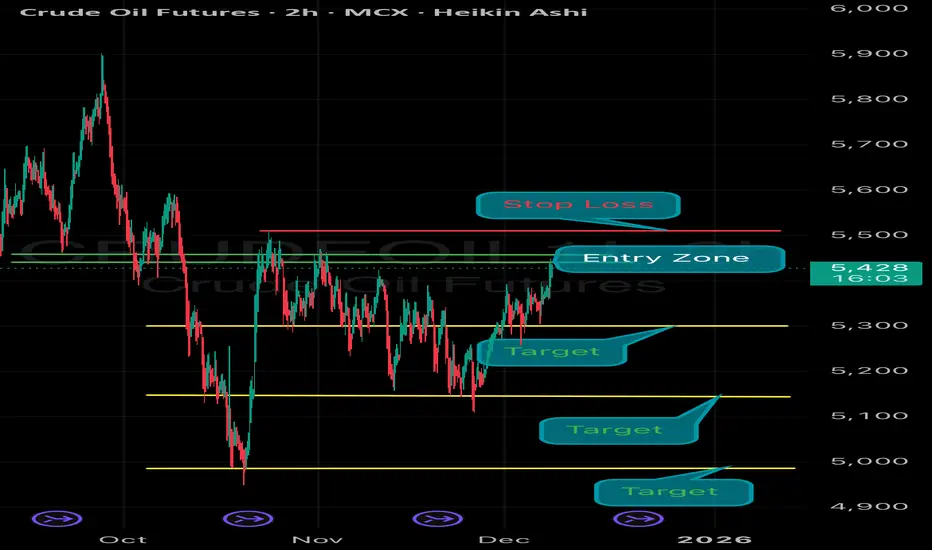
MCX Crude Oil Dec -Bearish Setup The chart has identified a Bearish Opportunity with a well-defined trade structure:
✅ Entry Zone: 5430 – 5440
🔒 Stop Loss: 5510 (Strict SL — no relaxation)
🎯 Target Zone: 5330 - 5200– 5100
⚠️ Risk Management Rule:
Once the trade achieves 1:1 Reward:Risk, immediately shift Stop Loss to Cost-to-Cost
Crude Oil Weekly Outlook: Inventory Pressure and 59.7 Key levelBackdrop: The Crude Oil Narrative
The tone in crude oil has been largely defined by a tug-of-war between demand uncertainty and controlled supply. OPEC has maintained its view that global oil demand should continue growing into 2026, but at a modest pace. Despite this, the group has acknowledged n

CRUDE OILDO YOU KNOW WHATS BEHIND THIS OR OTHER IDEAS?? in bio..
Preferably suitable for scalping and accurate as long as you watch carefully the price action with the drawn areas.
With your likes and comments, you give me enough energy to provide the best analysis on an ongoing basis.
And if you needed any

OIL looking at buy zone in weekly levels oil at yearly low and looking at very good buy opportunity as a swing trade
CL going for GAP closedue yesterday movement that weren't able to close above 59.64 , we will go lower today closing the gap.
a good 70p from here.

See all ideas
A representation of what an asset is worth today and what the market thinks it will be worth in the future.
Displays a symbol's price movements over previous years to identify recurring trends.