Possible New HighNo Resistences so Far. Nice Volume. Second Entry. Consolidation this week. If there is a gap opening above this consolidation the price can reach ATH.
3.09USD
755.60 MUSD
5.87 BUSD
243.44 M
About Church & Dwight Company, Inc.
Sector
Industry
CEO
Matthew Thomas Farrell
Website
Headquarters
Ewing
Employees (FY)
5.55 K
Founded
1846
ISIN
US1713401024
FIGI
BBG000BFJT36
Church & Dwight Co., Inc. engages in the development, manufacture, and marketing of household, personal care, and specialty products. It operates through the following segments: Consumer Domestic, Consumer International, Specialty Products, and Corporate. The Consumer Domestic segment offers household products, such as laundry detergents, fabric softener sheets, cat litter, and household cleaning products, and personal care products including antiperspirants, oral care products, depilatories, reproductive health products, oral analgesics, nasal saline moisturizers, and dietary supplements. The Consumer International segment sells personal care products, household and over-the-counter products in Canada, France, Australia, China, the United Kingdom, Mexico, and Brazil. The Specialty Products segment consists of sales to businesses which participated in different product areas, namely animal productivity, specialty chemicals, and specialty cleaners. The Corporate segment includes equity in earnings of affiliates from Armand and ArmaKleen in 2021, 2020 and 2019. The company was founded by Dwight John and Austin Church in 1846 and is headquartered in Ewing, NJ.

CHDChurch & Dwight is an American consumer goods company focusing on personal care, household products, and specialty products. The company was founded in 1847 and is headquartered in Ewing, New Jersey. It is the parent company of well-known brands such as Arm & Hammer, Trojan, OxiClean, and First Resp

Bullish swing on CHD.Thank you for watching my analysis on $NYSE:CHD.
I pray you and your families have a beautiful week filled with love, joy, and an abundance of wealth!
Joshua 1:9

Church & DwightCHD exceeded its outlook with stronger than expected sales growth and gross margin expansion. Earnings reported last week showed second quarter net sales grew 9.7% to $1.454.2 Bill and gross margin expanded by 270 basis points. CHD continues to experience strong consumer demand across its portfoli

Strong bear divs on CHDLast two tops were $98.33 and $100.52, however the last top was on lesser volume. Which has printed an obvious bearish divergence. Since the last high ($100.52), the stock has continued to decline and volume has continued to drop - printing more obvious bearish divergences.
This is a clear short, I

$CHD with a bullish outlook following its earnings #StocksThe PEAD projected a bullish outlook for $CHD after a negative over reaction following its earnings release placing the stock in drift C with an expected accuracy of 62.5%.
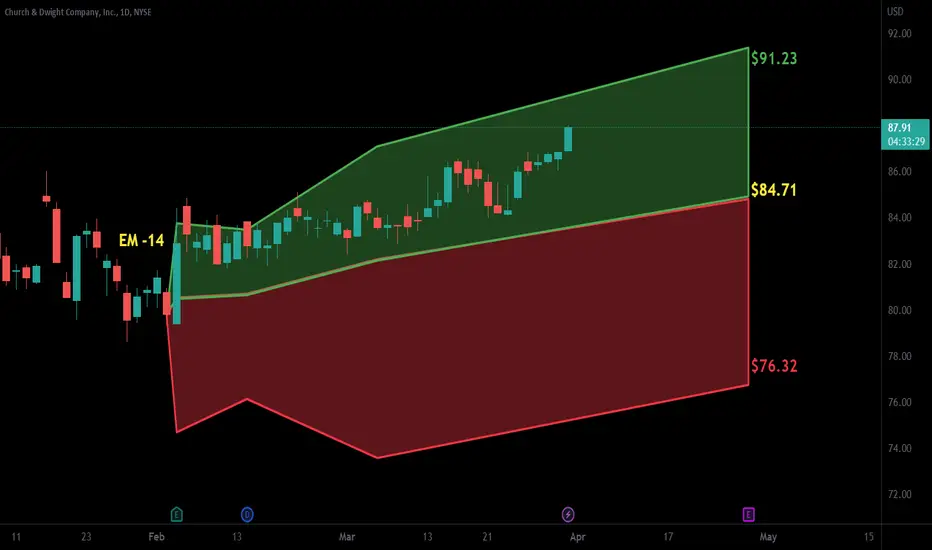
CHD long looks long towards 87.60. CHD long looks long towards 87.60. On SMA level buying price 84 range and looks first breaking point 87.60

CHD: confluence of moving averagesA bullish trend is applicable above 83.00.
The ideal entry is a price action as close to 82.00 as possible (200-day simple moving average) on a pullback.
However, breaking above 85.50 might trigger upside potential.
The first target price is set at 87.50.
The second target price is set at 92.50. (mi


CHD Long TermMy first EW chart from empty to primary count. Assumption is we are starting in a minor level 1 into 2 of intermediate wave 1, of a primary wave 1.

See all ideas
Trade directly on the supercharts through our supported, fully-verified and user-reviewed brokers.


Curated watchlists where CHD is featured.


Frequently Asked Questions
The current price of CHD is 103.74 USD — it has increased by 0.52% in the past 24 hours.
Depending on the exchange, the stock ticker may vary. For instance, on NYSE exchange Church & Dwight Company, Inc. stocks are traded under the ticker CHD.
Church & Dwight Company, Inc. is going to release the next earnings report on May 2, 2024. Keep track of upcoming events with our Earnings Calendar.
CHD stock is 1.76% volatile and has beta coefficient of 0.22. Check out the list of the most volatile stocks — is Church & Dwight Company, Inc. there?
One year price forecast for Church & Dwight Company, Inc. has a max estimate of 114.00 USD and a min estimate of 83.00 USD.
CHD earnings for the last quarter are 0.74 USD per share, whereas the estimation was 0.69 USD resulting in a 7.51% surprise. The estimated earnings for the next quarter are 0.65 USD per share. See more details about Church & Dwight Company, Inc. earnings.
Church & Dwight Company, Inc. revenue for the last quarter amounts to 1.46 B USD despite the estimated figure of 1.44 B USD. In the next quarter revenue is expected to reach 1.51 B USD.
Yes, you can track Church & Dwight Company, Inc. financials in yearly and quarterly reports right on TradingView.
CHD stock has risen by 2.47% compared to the previous week, the month change is a 1.06% fall, over the last year Church & Dwight Company, Inc. has showed a 15.07% increase.
CHD net income for the last quarter is 153.70 M USD, while the quarter before that showed 177.50 M USD of net income which accounts for −13.41% change. Track more Church & Dwight Company, Inc. financial stats to get the full picture.
Today Church & Dwight Company, Inc. has the market capitalization of 25.17 B, it has decreased by 3.01% over the last week.
Yes, CHD dividends are paid quarterly. The last dividend per share was 0.28 USD. As of today, Dividend Yield (TTM)% is 1.07%. Tracking Church & Dwight Company, Inc. dividends might help you take more informed decisions.
Church & Dwight Company, Inc. dividend yield was 1.15% in 2023, and payout ratio reached 35.72%. The year before the numbers were 1.30% and 62.48% correspondingly. See high-dividend stocks and find more opportunities for your portfolio.
Like other stocks, CHD shares are traded on stock exchanges, e.g. Nasdaq, Nyse, Euronext, and the easiest way to buy them is through an online stock broker. To do this, you need to open an account and follow a broker's procedures, then start trading. You can trade Church & Dwight Company, Inc. stock right from TradingView charts — choose your broker and connect to your account.
As of Apr 19, 2024, the company has 5.55 K employees. See our rating of the largest employees — is Church & Dwight Company, Inc. on this list?
Investing in stocks requires a comprehensive research: you should carefully study all the available data, e.g. company's financials, related news, and its technical analysis. So Church & Dwight Company, Inc. technincal analysis shows the buy rating today, and its 1 week rating is strong buy. Since market conditions are prone to changes, it's worth looking a bit further into the future — according to the 1 month rating Church & Dwight Company, Inc. stock shows the buy signal. See more of Church & Dwight Company, Inc. technicals for a more comprehensive analysis.
If you're still not sure, try looking for inspiration in our curated watchlists.
If you're still not sure, try looking for inspiration in our curated watchlists.
We've gathered analysts' opinions on Church & Dwight Company, Inc. future price: according to them, CHD price has a max estimate of 114.00 USD and a min estimate of 83.00 USD. Read a more detailed Church & Dwight Company, Inc. forecast: see what analysts think of Church & Dwight Company, Inc. and suggest that you do with its stocks.
EBITDA measures a company's operating performance, its growth signifies an improvement in the efficiency of a company. Church & Dwight Company, Inc. EBITDA is 1.25 B USD, and current EBITDA margin is 21.38%. See more stats in Church & Dwight Company, Inc. financial statements.