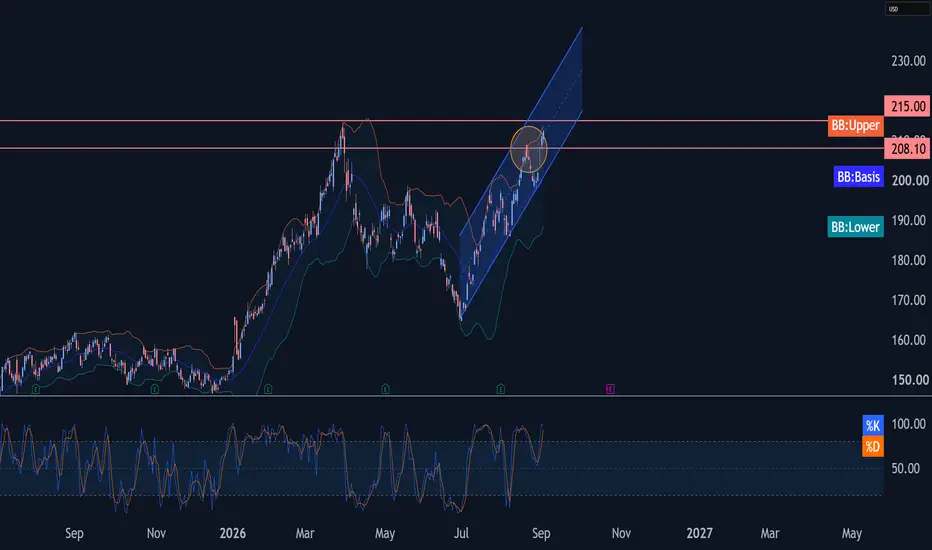
Chevron Wave Analysis – 2 September 2026– Chevron broke key resistance level 208.10
– Likely to rise to resistance level 215.00
Chevron previously broke above the key resistance level 208.10 (which stopped the previous minor impulse wave 1 in the middle of August).
The breakout of the resistance level 208.10 accelerated the active minor impulse wave 3 that belongs to the intermediate impulse wave (3) from the start of August.
Given the strong daily uptrend, Chevron can be expected to rise to resistance level 215.00 (that stopped th
In-depth trading ideas
CVX: Support Holds as Energy Momentum BuildsCVX found support and bounced at the 20-day moving average, which coincides with a key support zone. The stock remains in an uptrend, trading above both the 20- and 50-day moving averages.
Chevron Corp. is a $407bn market-cap company engaged in providing oil and gas energy solutions. It produces crude oil and natural gas, manufactures transportation fuels, lubricants, petrochemicals, and additives, and develops technologies for the energy industry. The company operates through its Upstream and
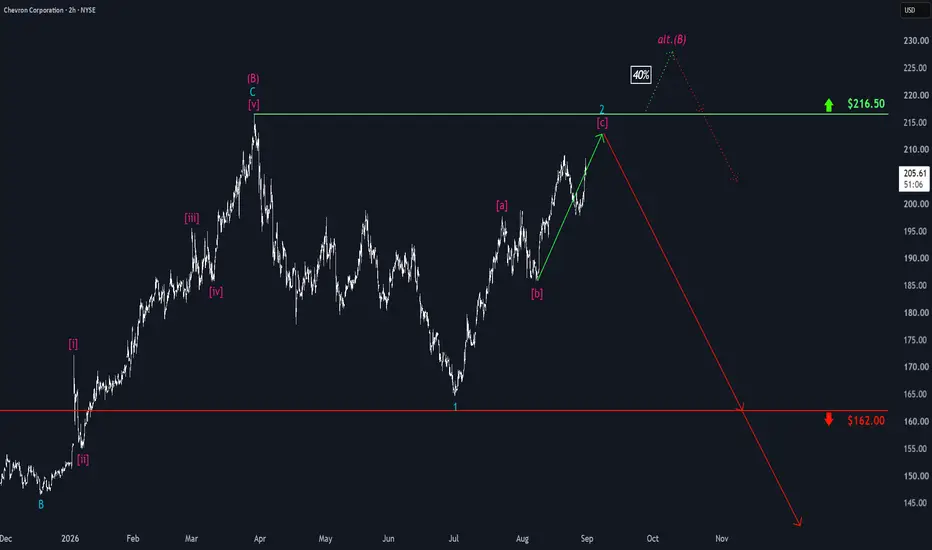
Chevron: Pullback and RecoveryChevron faced increased downward pressure over the past two weeks, which sparked a brief pullback. However, that move was quickly contained, and the stock is now in a dynamic recovery once again. In the primary scenario, we currently see the stock in a corrective upward move, with the high expected below resistance at $216.50. After that, we anticipate another downward move, which should take CVX below support at $162.00. Alternatively, continued strength is possible. In this case, the stock cou
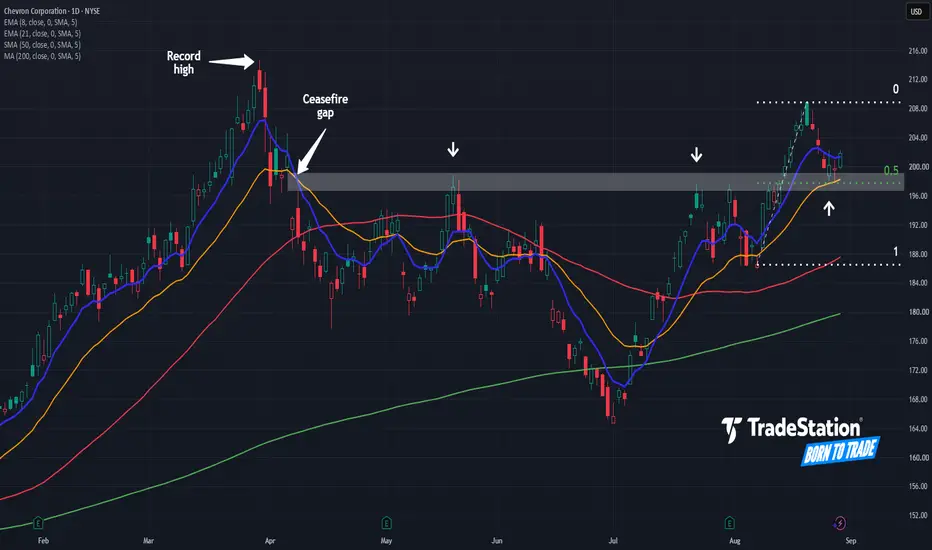
Will Chevron Break Out?Chevron is near record highs, and some traders may see potential for a breakout.
The first pattern on today’s chart is the price zone between $199.24 and $196.67 -- the low of April 7 and the high of April 9. It roughly matches the bearish gap after the initial ceasefire between Washington and Tehran. The oil-and-gas giant remained trapped under that range in mid-May and late July, but rallied above it in late August.
CVX tested and held the same price area last week, which could suggest that
Chevron — Bullish Momentum Aiming for $250Chevron is maintaining a favorable upside structure, with the latest price action indicating that bullish interest remains present in the market. The stock continues to attract buying participation, keeping the overall directional bias positive and creating room for further appreciation.
The main objective of this analysis is $250, which represents the projected destination for the current buy-side idea. As long as price continues to respect the prevailing upward structure and avoids a signific
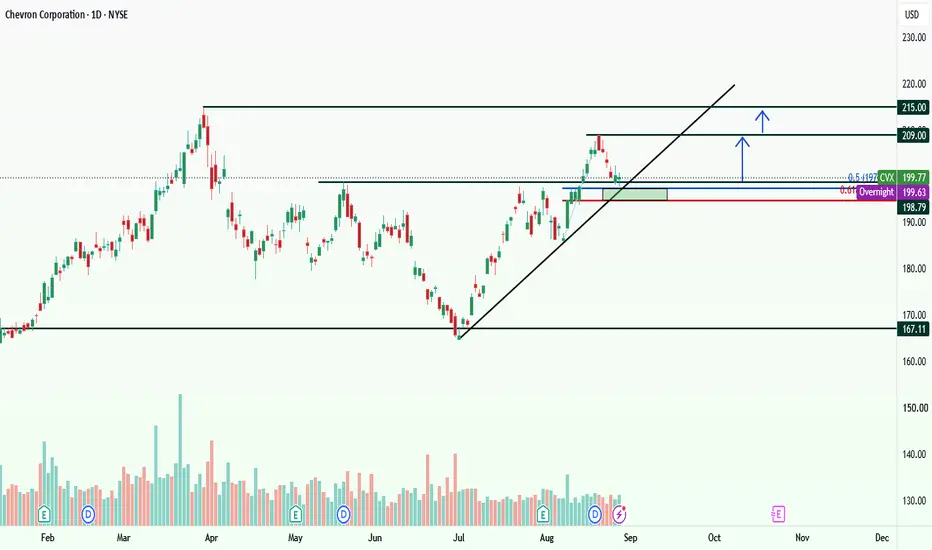
Buying opportunity - Uptrend
- It's a pullback to a broken level
- A correction has been completed until 50-61.8 Fib Ret
- There is a support on the ascending trend line
- There is a support on the horizontal trend line
- Below this level,197 , could be a good spot for setting SL
- Next targets can be 209 and 215
- Enter after having a good trigger, like a good bullish candle
CVX | Continued stock growth- Timeframe: Weekly
- Trade type: Buy stop order
- Price: 195.86
- Take Profit: Open
- Stop Loss: 185.87 (-5.10 %)
Idea: Long on a breakout above last week's high - bullish momentum continuation.
Entry: Buy stop above last week’s high.
Stop-loss: Below the low of the same candle.
If the weekly candle closes below this level, the trade is invalidated.
Chevron Wave Analysis – 14 August 2026
Chevron: ⬆️ Buy
– Chevron broke resistance level 196.75
– Likely to rise to resistance level 305.00
Chevron recently broke the resistance zone between the resistance level 196.75 (which has been reversing the price from May), and the 61.8% Fibonacci correction of the ABC correction 2 from April.
The breakout of this resistance zone accelerated the active intermediate impulse wave (3).
Given the clear daily uptrend, Chevron can be expected to rise to the next resistance level 205.00 – whi
CVX | Why Chevron is Primed in this Environment | LONGPrimed for a Breakout While Oil Squeezes the Economy
Chevron (CVX) is sitting at a key structural level while macroeconomic pressures mount. Here is the breakdown on the technical setup, the broader economic threat, and how to position short-term.
1. CVX: The Coiled Spring
CVX is acting like a beach ball held underwater—fundamental pressure is building while price consolidates near $192.
• Strong Catalysts: Record U.S. upstream production and massive free cash flow after solid quarterly earnin
As $USO goes $CVX $XOM will followAMEX:USO is currently making a v-shape recovery back to it's previous highs. Unsure if it will return there but this is my idea.
If AMEX:USO can get above the 61.8% on the fib around $134, I would say yes. Have you missed the entire move? No as it still will track back towards $150 before it will hit a bit of exhaustion, before another decision in the market is made.
Trade ideas NYSE:CVX NYSE:XOM
Sell Side Institutions vs Buy Side Institutions
Sell Side Institutions are the Money Center Banks and Giant Financial Services companies such as JPM Bank and Goldman Sachs, the Giant Financial Services company. Sell Side are short term traders. Each Bank and Financial Services company has a huge floor of traders. They do not use AI to make trading decisions. Mostly AI is used for routing on the millisecond.
Floor traders can and do use millisecond routing. Sell Side Institutions have access to all the retail side trading activity BEFORE the
Bearish potential detected for CVXEntry conditions:
(i) lower share price for NYSE:CVX along with continued lower highs and lower lows in the lagging indicator (green line) of the Ichimoku indicator, and
(ii) swing up of indicators such as DMI/ADX (bearish) and swing down in RSI, and
(iii) observe market reaction around the long-term support/resistance line of $172.65 from the open of 29th January.
Depending on risk tolerance, the stop loss for the trade would be:
(i) above the recent swing high of $176.40 from 23rd June, or
Chevron (CVX) is approaching a critical decision pointPrice is currently testing a key support level at $171.74, which corresponds to the high of Wave 1 from January. With CVX trading less than 1% above this level, the market is now at a pivotal stage for the broader wave count.
As long as support holds, the current structure continues to favor the completion of Wave A and the potential formation of a Wave B low, setting the stage for a Wave C advance to complete the larger Wave 2 correction. This scenario could open the door for a bullish correct
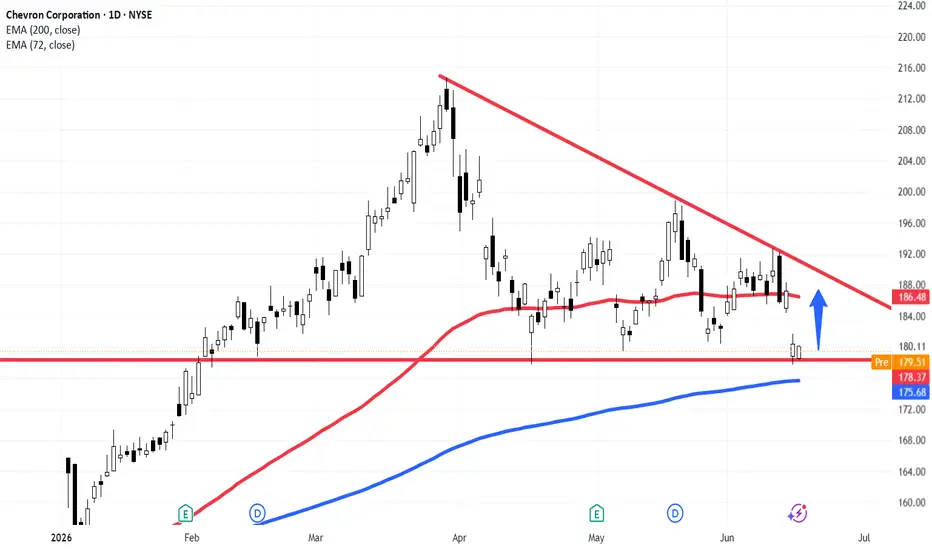
Chevron ($CVX) Daily: Testing Key Support – Mapping Risk Chevron ( NYSE:CVX ) Daily: Testing Key Support – Mapping Risk Profiles Near 200 EMA For Mean-Reversion Long
### 🛢️ Chevron Corporation ( NYSE:CVX ) Daily Technical Study (Ref: CVX_2026-06-17_11-53-39.png)
We are analyzing Chevron Corporation ( NYSE:CVX - NYSE) on the Daily (1D) timeframe, where price action is currently intersecting a critical structural value zone.
The stock concluded its last formal session printing at **180.11 (-0.16%)**, with immediate pre-market indicators registering
My #1 Gift For You --Buy This Stock NowThis stock is going to go up and here is why.
So about a week ago
this oil stock showed us a buy signal
and now it has bounced from the re-entry
It looks oversold
but this is now a short squeeze..
Now i must warn you
this strategy is a level 3
its the lowest trading strategy
but it will get you some scores
I know my audience..
i know you love stock options
so this one will make you happy this is my gift
to you for following
me for such a long time
now i wont be trading it
but my hope
Chevron Squeezes Near Old HighsChevron has been squeezing near previous highs, and some traders may see further upside.
The first pattern on today’s chart is November 2022’s record peak of $189.68. The oil-and-gas giant paused below that level before breaking out last March. CVX pulled back near it without a significant move below. Is old resistance becoming new support?
Speaking of support, the stock has bounced multiple times at the mid-February low of $178.75.
Third, long-term simple moving averages (SMAs) moved into a
CVX Chevron Corporation Options Ahead of EarningsIf you haven`t sold CVX before the retracement:
Now analyzing the options chain and the chart patterns of CVX Chevron Corporation prior to the earnings report this week,
I would consider purchasing the 200usd strike price Calls with
an expiration date of 2027-6-17,
for a premium of approximately $19.15.
If these options prove to be profitable prior to the earnings release, I would sell at least half of them.
CVX, Oil Price Spike to Fuel Bullish Trend!Hello There,
welcome to my new analysis about CVX (Chevron) on the global timeframe perspective. The oil shortage and oil price spikes are continue to increase. This is driving surplus earnings of oil companies such as CVX higher. Currently, there is an increased likelihood that this will continue.
As seen in my chart CVX already completed this massive ascending triangle formation. The breakout above the upper boundary has been the turning point of a massive spike in bullish volume and volati
CVX | Houston, We Have A Problem | LONGChevron Corp. engages in the provision of oil and gas energy solutions. It provides crude oil and natural gas, manufactures transportation fuels, lubricants, petrochemicals, and additives, and develops technologies that enhance business and the industry. It operates through the Upstream and Downstream segments. The Upstream segment consists of the exploration, development, and production of crude oil and natural gas, the liquefaction, transportation, and regasification associated with liquefied
What next for CVXChevron, Oil, and the Lag Effect: Mapping the Next Test Zone
This is a structural observation based on repeated behaviour between oil and Chevron (CVX), and how price has responded to prior impulses.
The relationship is straightforward in principle.
Oil leads. CVX follows, but with a delay.
How will that correlation express itself over time?
Looking at the chart, there are multiple instances where oil pushes aggressively higher while CVX lags. In each case, oil expands first, pauses or cons
Chevron in a years time 80% higherBullish view on Chevron, because the war in middle east is pushing oil prices higher.
There is a long term channel which the price action oscillates in
Although we dont normally draw flag targets like this there are several factors suggesting that this price action on the flag could develop
I think the flag pole length is extreme but it you mute it down a little we still have 100 % upside from its key level of support under a triangle
So even at todays price we still have like 80% to mov