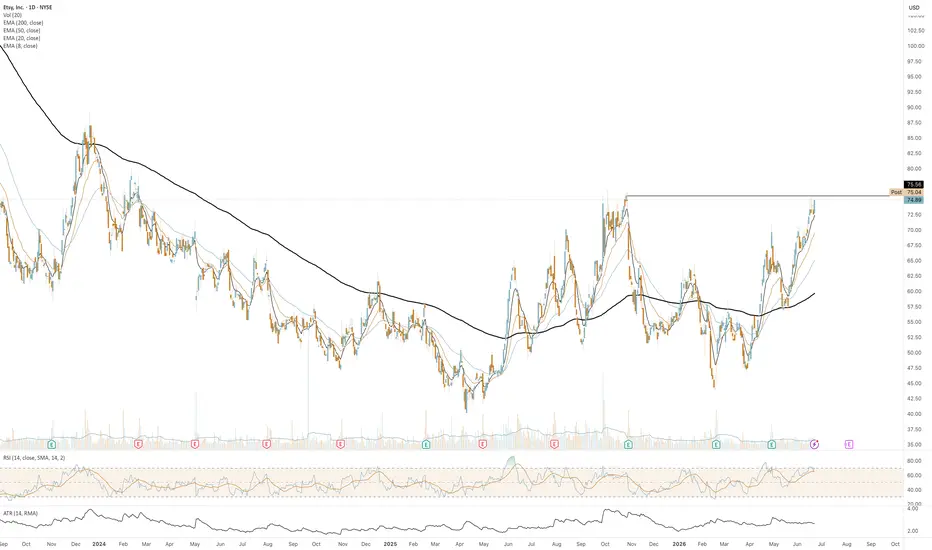
ETSY | Continued stock growth- Timeframe: Weekly
- Trade type: Buy stop order
- Price: 83.52
- Take Profit: Open
- Stop Loss: 77.90 (-6.70 %)
Idea: Long on a breakout above last week's high - bullish momentum continuation.
Entry: Buy stop above last week’s high.
Stop-loss: Below the low of the same candle.
If the weekly candle
Compare with Etsy, Inc.
2.12 USD
162.98 M USD
2.88 B USD
90.69 M
Next report date
—
Report period
—
EPS estimate
—
Revenue estimate
—
Company info
Sector
Industry
CEO
Kruti Patel Goyal
Website
Headquarters
New York
Founded
2005
IPO date
Apr 16, 2015
ISIN
US29786A1060
CUSIP
29786A106
FIGI
BBG000N7MXL8
Identifiers
ISIN US29786A1060
Etsy, Inc. operates online marketplaces that connect creative entrepreneurs with buyers worldwide. Its services include the operation of Etsy.com, a marketplace for unique and creative goods, as well as related e-commerce platforms and seller services. The company was founded in 2005 and is headquartered in New York, NY.
Etsy Inc. (ETSY): Bullish Structure Points Toward $102.43Etsy is pushing higher as improving company fundamentals and renewed Wall Street optimism align with a strengthening technical structure. With the stock trading around $85.98 on August 24, the chart is now approaching an important resistance area, while the broader Elliott Wave structure continues t
ETSY Showing Strength into NecklineFlagging into this neckline at $75
ETSY setting up in a tight bull flag — sharp 33.0% pole from $56.71 to $75.43, now consolidating over the last 3 sessions. Holding above the EMAs with the flag low at $72.48. Measured-move target $89.96 on the break, stop under the flag at $71.76.
#bullflag #flag
$ETSY has >11% FreeCashFlow Yield! Sometimes great returns are just staring us in the face and those returns seem risky since the price of an asset has been falling for a while we never know when the bottom is in.
So, when we get a technical "trending up" signal like we are seeing in the monthly chart AND we have a great "free cash
Where's ETSY is going? Etsy, Inc. (in English: ETSY) is an American online marketplace platform primarily intended for handmade, vintage, and unique products from individual creators around the world (Wikipedia).
The company allows individual sellers to display and sell their creations conveniently, which turns the platf
Etsy, Inc. (ETSY)Description: ETSY is showing a bullish rebound from the lower boundary of an ascending channel. The price has successfully held the horizontal support zone near $55.00.
Goal (Target): $82.07, targeting the upper resistance of the long-term trend channel.
Stop-Loss: $52.00, placed below the channel
ETSY eyes on $73.37.48: Double Fib high support for Next LegESTY trying to paint a long term bottom with a strong push.
Currently orbiting a key Double Fib zone at $73.37-73.48
Look for a Break-n-Retest or Dip-to-Fib at $71.06 for entries.
.
See "Related Publications" for previous plots of this struggle to bottom out.
.
$ETSY: Ready for Stage 2 Breakout?Technical Analysis
ETSY appears to be developing two significant technical patterns. The first is a Volatility Contraction Pattern (VCP), which often signals a potential breakout as volatility diminishes and price tightens. The second pattern is a Base on Base formation, suggesting a period of cons
See all ideas
Summarizing what the indicators are suggesting.
Neutral
Neutral
Neutral
An aggregate view of professional's ratings.
Neutral
Neutral
Neutral
Displays a symbol's price movements over previous years to identify recurring trends.
Maturity dateSep 1, 2027
Coupon0.13% (Fixed)
Maturity dateJun 15, 2028
Coupon0.25% (Fixed)
Maturity dateJun 15, 2030
Coupon1.00% (Fixed)
See all ETSY bonds
Frequently asked questions
The current price of ETSY is 85.14 USD — it has increased by 7.54% in the past 24 hours. Watch Etsy, Inc. stock price performance more closely on the chart.
Depending on the exchange, the stock ticker may vary. For instance, on NYSE exchange Etsy, Inc. stocks are traded under the ticker ETSY.
ETSY stock has risen by 25.87% compared to the previous week, the month change is a 16.67% rise, over the last year Etsy, Inc. has showed a 16.65% increase.
We've gathered analysts' opinions on Etsy, Inc. future price: according to them, ETSY price has a max estimate of 105.00 USD and a min estimate of 59.00 USD. Watch ETSY chart and read a more detailed Etsy, Inc. stock forecast: see what analysts think of Etsy, Inc. and suggest that you do with its stocks.
ETSY reached its all-time high on Nov 26, 2021 with the price of 307.75 USD, and its all-time low was 6.04 USD and was reached on Jan 20, 2016. View more price dynamics on ETSY chart.
See other stocks reaching their highest and lowest prices.
ETSY stock is 6.48% volatile and has beta coefficient of 1.87. Track Etsy, Inc. stock price on the chart and check out the list of the most volatile stocks — is Etsy, Inc. there?
Today Etsy, Inc. has the market capitalization of 8.19 B, it has decreased by −0.14% over the last week.
Yes, you can track Etsy, Inc. financials in yearly and quarterly reports right on TradingView.
Etsy, Inc. is going to release the next earnings report on Oct 28, 2026. Keep track of upcoming events with our Earnings Calendar.
ETSY earnings for the last quarter are 0.98 USD per share, whereas the estimation was 0.75 USD resulting in a 31.19% surprise. The estimated earnings for the next quarter are 0.76 USD per share. See more details about Etsy, Inc. earnings.
Etsy, Inc. revenue for the last quarter amounts to 668.31 M USD, despite the estimated figure of 646.10 M USD. In the next quarter, revenue is expected to reach 668.05 M USD.
ETSY net income for the last quarter is −46.65 M USD, while the quarter before that showed 69.68 M USD of net income which accounts for 0.00% change. Track more Etsy, Inc. financial stats to get the full picture.
No, ETSY doesn't pay any dividends to its shareholders. But don't worry, we've prepared a list of high-dividend stocks for you.
As of Oct 16, 2026, the company has 2.38 K employees. See our rating of the largest employees — is Etsy, Inc. on this list?
EBITDA measures a company's operating performance, its growth signifies an improvement in the efficiency of a company. Etsy, Inc. EBITDA is 539.96 M USD, and current EBITDA margin is 16.63%. See more stats in Etsy, Inc. financial statements.
Like other stocks, ETSY shares are traded on stock exchanges, e.g. Nasdaq, Nyse, Euronext, and the easiest way to buy them is through an online stock broker. To do this, you need to open an account and follow a broker's procedures, then start trading. You can trade Etsy, Inc. stock right from TradingView charts — choose your broker and connect to your account.
Investing in stocks requires a comprehensive research: you should carefully study all the available data, e.g. company's financials, related news, and its technical analysis. So Etsy, Inc. technincal analysis shows the buy rating today, and its 1 week rating is strong buy. Since market conditions are prone to changes, it's worth looking a bit further into the future — according to the 1 month rating Etsy, Inc. stock shows the buy signal. See more of Etsy, Inc. technicals for a more comprehensive analysis.