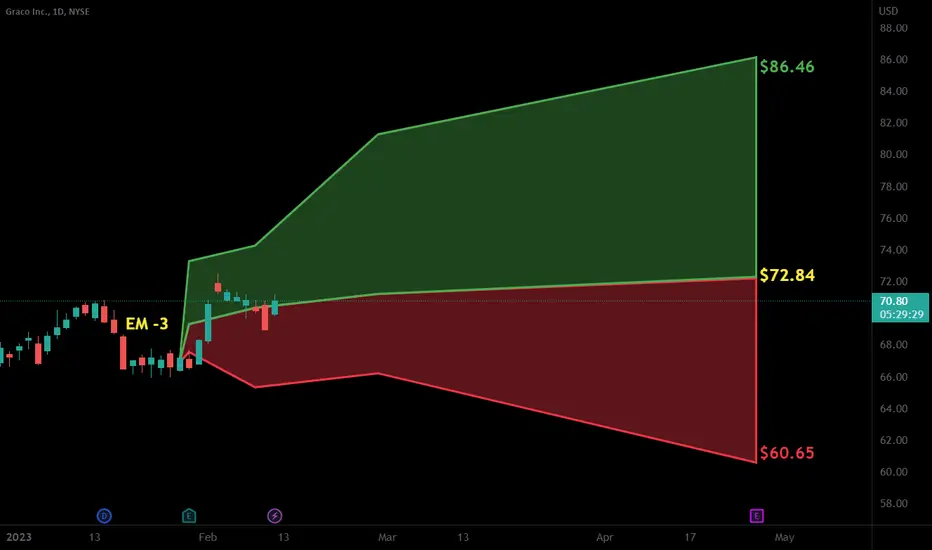
Retest support. MACD Buy. Try to retest previous resistance.1. Retest support.
2. MACD Buy.
3. Try to retest previous resistance at 73.00.
4. TAYOR & Good Luck!
3.01USD
506.51 MUSD
2.20 BUSD
166.47 M
About Graco Inc.
Sector
Industry
CEO
Mark WIlliam Sheahan
Website
Headquarters
Minneapolis
Employees (FY)
4 K
Founded
1926
ISIN
US3841091040
FIGI
BBG000BK9W84
Graco, Inc. is a manufacturing company, which engages in the design, manufacture, and sale of systems and equipment used to move, measure, control, dispense, and spray fluid and powder materials. It operates through the following segments: Industrial, Process, and Contractor. The Industrial segment markets equipment and pre-engineered packages for moving and applying paints, coatings, sealants, adhesives, and other fluids. The Process segment includes pumps, valves, meters, and accessories to move and dispense chemicals, oil and natural gas, water, wastewater, petroleum, food, lubricants, and other fluids. The Contractor segment offers sprayers that apply texture to walls and ceilings, and highly viscous coatings to roofs and markings on roads, parking lots, athletic fields, and floors. The company was founded by Russell Gray and Leil Gray in April 1926 and is headquartered in Minneapolis, MN.

$GGG with a bullish outlook following its earnings #Stocks The PEAD projected a bullish outlook for $GGG after a positive under reaction following its earnings release placing the stock in drift A with an expected accuracy of 85.71%.
GGG - Short Setup Not huge insider selling recently but some. Break below 74.47. Target 65.13, Stop 77.13.

Market Alpha Watchlist - GGGSymbol: NYSE:GGG
Type: Watchlist Alert
Indicators
Laguerre RSI
Multi-Time Frame EMA
Opinion: Long term bull trend coming into some resistance but may be able to get through.
DONT POST BELOW!
Tags: marketalpha, long, short, calls, puts, bulls, bears, watchlist, stocks

Reversal play Reward/Risk: 5/1
Entry: 69.41 or at a lower price
Stop: 67.50
Target: 78.00
Options Play: March 19 70/75 Call Vertical
Could be a decent infrastructure/relation trade assuming the recovery continues

$GGG #Breakout SetupAnother stock with strong close on Friday. This one I bought on Wed 12/09 right before the close.
Reason:
While the market was selling of Wed, $GGG close positive for the day on higher than average volume. Impressive relative strength in a constructive consolidation base. Looking for the stock

GRACO PictureHey traders, GRACO is at a very important moment in its history we can witness a new historical high. GRACO is in a fake bearish push with a large volume of sales executed, it will break its trend support to go on the back of the last previous lower and then turn around.
Strong potential to breakou


Graco, Inc Bullish Reversal Company profile
Graco, Inc. is a manufacturing company, which designs, manufactures and markets systems and equipment used to move, measure, control, dispense and spray fluid and powder materials. It operates through the following segments: Industrial, Contractor and Process. The Industrial segment
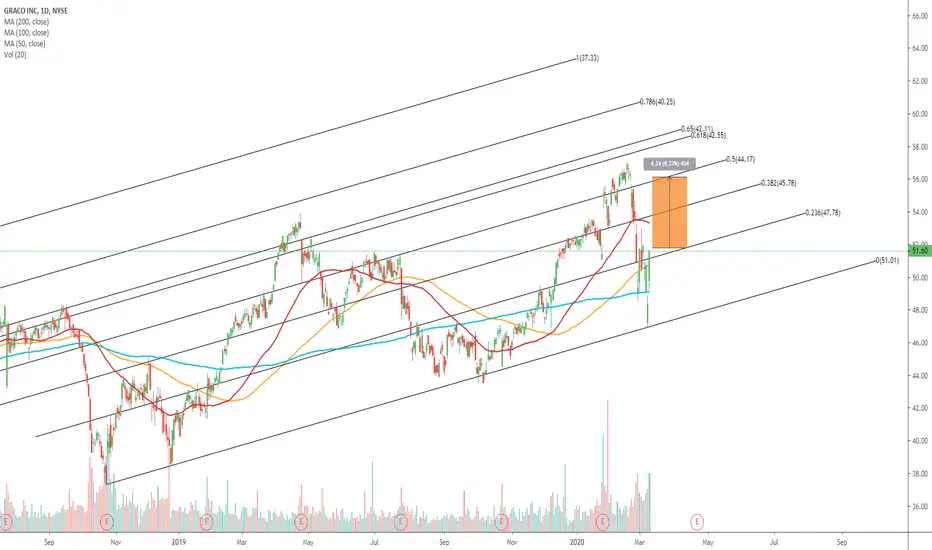
GRACO Inc. #GGGAll three time frames are up
price has been rallying for 4 months
expecting a bigger retracement
looking to go long when price retraces to the origin of the move at 45 dollar a share.

See all ideas
Trade directly on the supercharts through our supported, fully-verified and user-reviewed brokers.


Frequently Asked Questions
The current price of GGG is 88.10 USD — it has increased by 0.01% in the past 24 hours.
Depending on the exchange, the stock ticker may vary. For instance, on NYSE exchange Graco Inc. stocks are traded under the ticker GGG.
Graco Inc. is going to release the next earnings report on Apr 24, 2024. Keep track of upcoming events with our Earnings Calendar.
GGG stock is 1.15% volatile and has beta coefficient of 1.08. Check out the list of the most volatile stocks — is Graco Inc. there?
One year price forecast for Graco Inc. has a max estimate of 110.00 USD and a min estimate of 82.00 USD.
GGG earnings for the last quarter are 0.76 USD per share, whereas the estimation was 0.73 USD resulting in a 3.97% surprise. The estimated earnings for the next quarter are 0.79 USD per share. See more details about Graco Inc. earnings.
Graco Inc. revenue for the last quarter amounts to 539.70 M USD despite the estimated figure of 557.12 M USD. In the next quarter revenue is expected to reach 561.88 M USD.
Yes, you can track Graco Inc. financials in yearly and quarterly reports right on TradingView.
GGG stock has fallen by 2.28% compared to the previous week, the month change is a 4.92% fall, over the last year Graco Inc. has showed a 25.71% increase.
GGG net income for the last quarter is 109.95 M USD, while the quarter before that showed 133.12 M USD of net income which accounts for −17.41% change. Track more Graco Inc. financial stats to get the full picture.
Today Graco Inc. has the market capitalization of 14.81 B, it has increased by 0.60% over the last week.
Yes, GGG dividends are paid quarterly. The last dividend per share was 0.25 USD. As of today, Dividend Yield (TTM)% is 1.09%. Tracking Graco Inc. dividends might help you take more informed decisions.
Graco Inc. dividend yield was 1.11% in 2023, and payout ratio reached 32.64%. The year before the numbers were 1.29% and 32.47% correspondingly. See high-dividend stocks and find more opportunities for your portfolio.
Like other stocks, GGG shares are traded on stock exchanges, e.g. Nasdaq, Nyse, Euronext, and the easiest way to buy them is through an online stock broker. To do this, you need to open an account and follow a broker's procedures, then start trading. You can trade Graco Inc. stock right from TradingView charts — choose your broker and connect to your account.
As of Apr 19, 2024, the company has 4.00 K employees. See our rating of the largest employees — is Graco Inc. on this list?
Investing in stocks requires a comprehensive research: you should carefully study all the available data, e.g. company's financials, related news, and its technical analysis. So Graco Inc. technincal analysis shows the sell today, and its 1 week rating is neutral. Since market conditions are prone to changes, it's worth looking a bit further into the future — according to the 1 month rating Graco Inc. stock shows the buy signal. See more of Graco Inc. technicals for a more comprehensive analysis.
If you're still not sure, try looking for inspiration in our curated watchlists.
If you're still not sure, try looking for inspiration in our curated watchlists.
We've gathered analysts' opinions on Graco Inc. future price: according to them, GGG price has a max estimate of 110.00 USD and a min estimate of 82.00 USD. Read a more detailed Graco Inc. forecast: see what analysts think of Graco Inc. and suggest that you do with its stocks.
EBITDA measures a company's operating performance, its growth signifies an improvement in the efficiency of a company. Graco Inc. EBITDA is 754.62 M USD, and current EBITDA margin is 32.73%. See more stats in Graco Inc. financial statements.