JP MORGAN on a macro Bearish Divergence targeting $280.JP Morgan Chase (JPM) has been trading within a 15-year Channel Up and since August it's on a pull-back that has so far found support on the 1W MA50 (blue trend-line). The distinct development here is that since September 2025, its 1M RSI has been under Lower Highs, which against the stock's Higher Highs is a Bearish Divergence.
Every time this formation emerged within this macro pattern, JPM corrected by at least -23.66% on a technical Bearish Leg. If we repeat that, expect the market to reach
In-depth trading ideas
JPM Can the $345 Breakout Unlock a Move Toward $370?JPMorgan (JPM): Can the $345 Breakout Unlock a Move Toward $370?
Ticker: NYSE:JPM
Chart: 4H,
Reference Close: $339.50
Market Outlook: Fed Policy Meets Banking-Sector Strength
JPMorgan is approaching an important technical decision point as investors reassess the Federal Reserve's policy outlook and its implications for financial stocks.
A neutral-to-hawkish Fed environment could favor relative strength in selected banks compared with rate-sensitive growth stocks. However, higher interest
JPM - Bull Flag Loading. Kinexys Just Changed the Game.NYSE:JPM ➖ Bull Flag Loading. Kinexys Just Changed the Game.
Price: $314.90 | Targets: $314.90 → $337.25
The chart is textbook. NYSE:JPM is coiling in a clean bull flag after a sharp flagpole rally off the lows ➡️ consolidation channel is tightening, and a breakout is looking imminent.
Prior new high at $337.25 is the first magnetic level; extended target sits at $347.74 on continuation.
But here's what makes this more than just a technical play 👇
JPMorgan's Kinexys platform just compl
JPM (JPMorgan) | Long/Buy Trade IdeaJPM (JPMorgan) | Long/Buy Trade Idea
JPM has reached the $332 Demand Zone, an important higher timeframe bullish support area.
If price produces a strong bounce from this zone and breaks above the descending trendline on the daily chart, we can look for a potential Long opportunity through Call options.
Trigger: Price must break decisively above the descending trendline on the daily chart, then retest and hold above the broken trendline with bullish confirmation.
Target 1: $353
Target 2: $36
JPM - Looks heavyI try not to just find trades because I want to find them. But when they look obvious, I want to trade them.
JPM has bounced off of the same level 5 times in the past month (which happens to be an important previous ATH pivot level).
But it looks weak to me. And if the opportunity presents itself for a short trade up at these levels, I will take it toward that level, with profits there and runners for beyond.
Before anything, I am looking for this important level at $343.33 to get "grabbed"
JPMorgan (JPM) Call/Buy IdeaJPM | Long/Buy Trade Idea
Price found a strong bounce from the $332 Demand Zone, broke above the descending trendline, and closed above it.
A strong bullish market open could confirm further upside momentum.
If we see bullish price action after the opening bell, I'll look to open a Long position through Call options, targeting the levels below.
Target 1: $353
Target 2: $365
Invalidation: Daily close below the Demand Zone (324$)
We'll wait for confirmation before entering the trade.
Two Key Reasons Why Banks Are SellingToday, I will discuss the two key reasons why bank stocks are selling off, and whether there is more pain to come.
We saw many banks hit their historical all-time highs starting in July before selling off to their low in early October. JP Morgan (JPM) was down 11%, Singapore's largest bank, DBS (D05), dropped 9%, and Goldman (GS) was down a staggering 22%,.
In fact, Goldman seems to have led the banking decline.
In our case study on 20 July, we spotted an inverted hammer on its weekly chart.
JPM | Is JPMorgan’s Growth Story Losing Steam?JPMorganChase grew revenue 8% year over year to $50.2 billion, but missed analyst expectations by $300 million. Net income rose 6% to $15.3 billion, while adjusted EPS came in at $5.75, falling $0.19 short of forecasts after excluding $658 million in investment securities losses. Net interest income was the main driver, climbing 13% to $27 billion, while noninterest income increased 3% to $23.1 billion
The results show a bank still generating solid growth, even as some of Wall Street's biggest
JPMorgan 4H: tested the line, not stampedJPMorgan came down to its structural reference last week for the first time since June, held it by less than a dollar without a stamp, and now sits under three unfilled gaps left by the September decline - with earnings due before today's open.
This is NYSE:JPM JPMorgan Chase on the 4-hour chart, about six months of it, with two of our free layers on the chart. Accumulate draws a reference and opens a zone when price falls below it - the stretch where a structural base gets built over time.
JPMorgan (JPM): Bullish Reversal at $328 Support — Targeting$363JPMorgan Chase (JPM) is showing signs of a potential bullish reversal after reaching a major support zone around $328. With technical support aligning with my trendline and positive fundamental developments in focus, I am watching for a possible recovery toward $363.
Fundamental Analysis
My bullish outlook is supported by developments that could strengthen JPMorgan’s business outlook and attract market attention.
First, JPMorgan’s reported plan to establish merchant banking operations in Nige
JPM: The 325.5 Sweep Was Bought. Earnings Decide If 336.3 BreaksNYSE:JPM swept the lows at 325.5, ripped back, and then got slapped at 336.3. Now it sits at 334 with earnings hitting before Tuesday's open.
📍 Why this chart matters before Tuesday
JPM reports Q3 on Tuesday, October 13, before the open. Consensus EPS sits near $5.9, and last quarter the bank beat by roughly 10%. Options are pricing a move of about 5% either way, so this is not a quiet print. The 1h chart is where I want to find my levels before the gap.
Two sweeps, one story
The big pict
JPM – Holding Above HVL into Earnings, 345 Call Wall in FocusJPM is holding the bounce from the 330 HVL regime pivot on the daily chart, with earnings due Tuesday. Spot sits in a positive GEX regime above HVL, just through the start of the call cluster, with the dominant call wall still overhead at 345.
🔶 Regime Context 🔶
Price is trading above 330 – HVL , keeping JPM inside a positive GEX regime. The call cluster starts at 332.5 (cTrans) ; spot is just above that line and still below C1. GEX History on the daily is aligned positive across 0 / W1 / M1
JPM into earnings: the trendline is the whole storyJPM reports tomorrow before the open, and the chart is sitting at a spot where one print can decide a lot.
JPM has been in a long uptrend, and the rising trendline from the April 2025 low has held as support three times: April 2025, June 2026 and last week. Price topped out around 366, pulled back about 9%, and now sits at 334.71, right on the trendline and just above the horizontal support at 325.
Above price is the 337.92 to 345.60 resistance zone. That's where I expect a bounce into, and w
JPMorgan Pulls Back Before EarningsJPMorgan Chase has pulled back, but it may be stabilizing as earnings approach.
The first pattern on today’s chart is the decline since early September. JPM bounced near a weekly close from June early this month, followed by a retest last week. That double bottom may suggest the downward move is finished.
Second, the financial giant is pushing through a falling trendline.
Next, the recent lows occurred above the rising 200-day simple moving average (SMA). The 100-day SMA is also above the 200
JPM Momentum Heading Into the Earnings PrintJPMorgan reports before the open on Tuesday. It arrives with one of the cleanest earnings track records on Wall Street.
The bank has beaten EPS consensus in each of its last four quarters, and the beats have been getting larger. It posted $5.07 against $4.83 in Q3 2025, then $5.23 against $4.87. After that came $5.94 against $5.49, and most recently $6.14 against $5.59. That last print was a 9.8% surprise and a record quarter for both revenue and profitability.
Growth is coming from the top l
Is JPMorgan a Bank or a Global Tech Empire?JPMorgan Chase enters the Q3 2026 earnings season facing immense expectations, but traditional financial metrics fundamentally misprice the firm. Operating more like a global technology monopoly than a commercial lender, the bank is aggressively replacing legacy systems like SWIFT with its proprietary Kinexys platform. By securing foundational patents for token-based cross-currency interoperability, JPMorgan executes instant, decentralized cross-border settlements. This infrastructure, fortified
JPM: Earnings Reversal or Bull Trap? | Oct 12–16
JPM is recovering, but the daily chart still has something to prove. The short-term bounce is constructive; $340–$345 is where I’ll judge whether it can develop into a broader reversal.
Daily timeframe
The decline from $366.50 to $325.07 established a clear sequence of lower highs and lower lows. Recent green candles show buyers responding near $325, but the daily price around $332.99 remains below the $340–$345 resistance area.
Holding $330 keeps the recovery intact. A daily close above $34
JPM — BuyJPMorgan Chase & Co. (JPM) — Buy 61/100
JPMorgan has the sector’s strongest balance sheet and highest ROE, yet its shares have pulled back with a sector-wide selloff. The long-term trend remains intact above SMA200, but the case favors gradual accumulation: business quality supports buying, while the absence of insider purchases argues against rushing.
Data as of the 2026-10-03 close.
WHY
- ROE of 17.79% leads all peers, supporting the bank’s sector-leading financial quality.
- Of 22 analysts
JPM: Key Support Under PressureJPMorgan remains in a daily correction after peaking around $365–367 in August. Lower highs and lower lows, together with price trading below the declining Bollinger midpoint, keep the short-term bias bearish.
The current bounce near $325–326 shows buying interest, but a bullish reversal still needs confirmation.
Key levels
- Support: $325–326, followed by $318–320 and $310–312.
- Resistance: $338–342, then $347–350.
- Higher resistance: $355–360 and $365–367.
As long as $325–326 hol
JPM – Waiting for a Better EntryJPMorgan’s long-term structure remains constructive, but the stock is currently pulling back after failing near the $354–$366 resistance area.
At $340 , the price is testing its 20-week EMA around $339.70. Momentum remains neutral, with the weekly RSI near 53, while the rising 50-week SMA around $319 provides an important structural support.
I am a buyer of JPM at $325. This level would offer a more attractive risk/reward profile and sits within the broader $319– $325 support zone.
- Entry:
Major Breakout Retest at 337.43 Key Horizontal LevelOVERVIEW
JPMorgan Chase & Co. (JPM) is testing a critical horizontal pivot at 337.43 on the daily chart following an aggressive -3.42% pullback to close at 340.00. This level marks the multi-month resistance breakout zone established in early 2026, which is now being tested as support. While the primary directional bias (larger green arrow) favors a bullish defense and continuation toward previous highs near 365.00, confirmation strictly requires a clear reversal signal or daily defense above 3
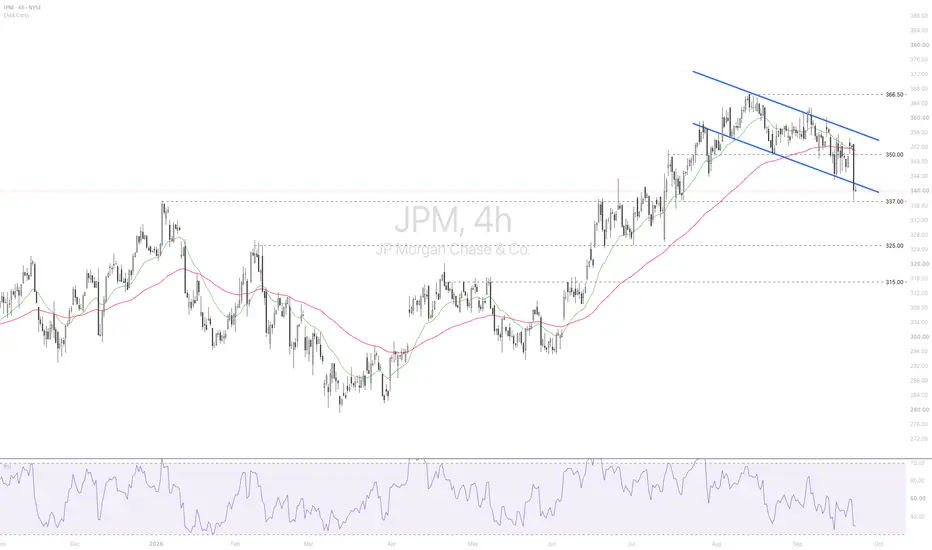
AI agent market interfere fears drove by 'Muse' hit JPMorganJPM | 4H Technical Analysis — Sep 23, 2026
JPMorgan is sliding after falling into the crosshairs of a broader market rotation around AI disruption risk. Goldman Sachs flagged telecom, insurance, and utilities as sectors most exposed if AI agents make it easier and cheaper for consumers to switch service providers, warning that companies have long profited from what it calls consumer inertia, the tendency for people to keep paying for services or products out of habit even when better alternati
JPM Short Setup: Change of Character & Key Level EntryJPMorgan ( NYSE:JPM ) is approaching a key level where I’m watching for a potential bearish move. On the 4-hour timeframe, there is a change in pattern, while the daily and weekly timeframes are showing a Change of Character (CHoCH). This combination gives me a reason to look for a pullback toward the lower support levels.
Trade Setup
* Entry: $351.60
* Stop Loss: $360.94
* TP1: $337.66–$337.69
* Final Target: $328.57
My expectation is for JPM to move lower this week from the $351.60 key leve