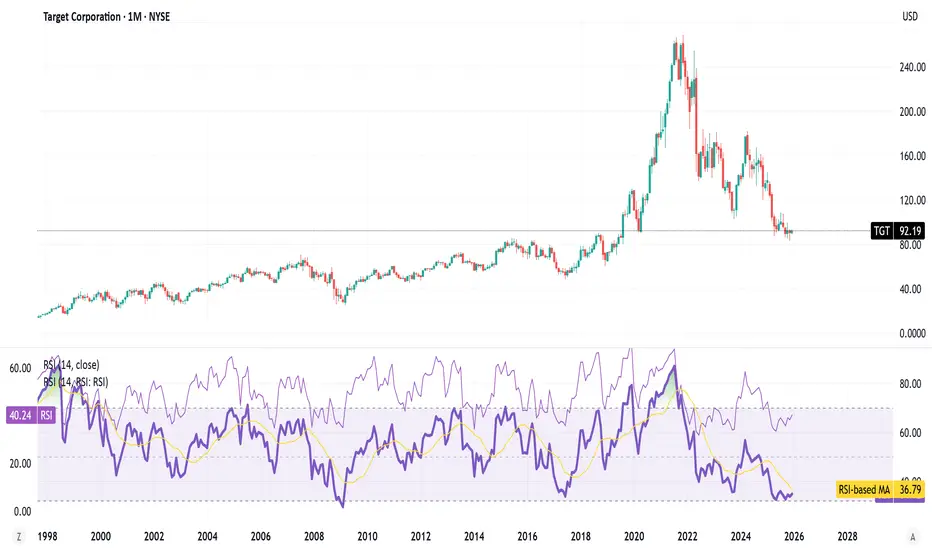
TGT Should be in our "Watch " list. Trough in "Progress"RSI, a momentum indicator in technical analysis measuring speed/magnitude of price changes (overbought >70, oversold <30).
Key facts today
Next report date
—
Report period
—
EPS estimate
—
Revenue estimate
—
8.27 USD
4.09 B USD
106.57 B USD
451.63 M
About Target Corporation
Sector
Industry
CEO
Brian C. Cornell
Website
Headquarters
Minneapolis
Founded
1902
ISIN
US87612E1064
FIGI
BBG000H8TVT2
Target Corp. engages in the operation and ownership of general merchandise stores. It offers food and general merchandise, clothing and household goods, electronics, and toys. Its brands include A New Day, All in Motion, Art Class, Auden, AVA & VIV, Boots and Barkley, Brightroom, Bullseye's Playground, Casaluna, Cat & Jack, Cloud Island, Colsie, dealworthy, Embark, Everspring, Favorite Day, Figmint, Future Collective, Gigglescape, Good & Gather, Goodfellow & Co, Hearth & Hand with Magnolia, Heyday, Hyde & EEK! Boutique, JoyLab, Kindfull, Kona Sol, Made By Design, Market Pantry, Mondo Llama, More Than Magic, Opalhouse, Open Story, Original Use, Pillowfort, Project 62, Room Essentials, Shade & Shore, Smartly, Smith & Hawken, Sonia Kashuk, Spritz, Sun Squad, Threshold, Universal Thread, up&up, Wild Fable, Wondershop, Xhilaration, California Roots, Casa Cantina, The Collection, Headliner, Jingle & Mingle, Rosé Bae, Photograph, SunPop, and Wine Cube. The company was founded by George Draper Dayton in 1902 and is headquartered in Minneapolis, MN.
Related stocks
$TGT Weekly Target $quezeWeekly is squeezing tight, looking for a possible momentum shift as its been very quiet and low volume compare to just a few years ago. Targeting $110-$130 in the short-term.

$TGT - Target - Pre-Covid Price LevelsTarget is down 67% from its all time highs.
Not sure how much more of a beating this stock price can take before value catches up.
Intrinsic Value calculations put this stock 40-60% undervalued. Some analysts suggest caution as sales declined around 2.7% in Quarter 3 and showed a higher operating

TGT QuantSignals V3 — Earnings Downside Alert TGT QuantSignals V3 Earnings 2025-11-18
Direction: BUY PUTS
Confidence: 65%
Expiry: 2025-11-21 (3 days)
Strike Focus: $86.00
Entry Range: $2.59
Target 1: $5.08
Stop Loss: $1.52
Implied Move: $8.62 (9.6%)
24h Move: -0.53%
Options Flow: Bearish (High P/C Ratio) | PCR 1.76
Earnings Date: 202
TGT Bullish Divergence Weekly MACD-H and EFIBullish divergence on MACD-H, MACD lines, EFI, ATR channel divergence, even divergence on Stochastic RSI.
TP
100.51
E
90.8
SL
84.46
Trade #00015

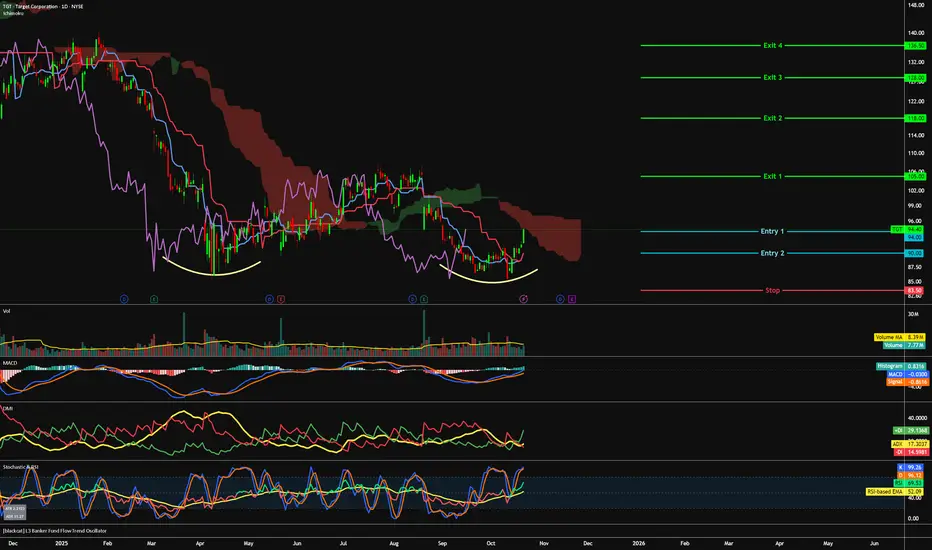
TGT 1D - hitting the target?On the daily chart, Target Corporation (TGT) has finally broken out of its long downtrend and closed above the consolidation box. The setup suggests a potential bullish reversal with targets at $123 and $146.8.
Technically , the structure looks solid: a possible retest of the breakout zone could

TGT - Seeking a new target=======
Volume
=======
- slight increase
==========
Price Action
==========
- double bottom / Rounding bottom noticed
=================
Technical Indicators
=================
- Ichimoku
>>> price below cloud, piercing cloud
>>> Red kumo contracting
>>> Tenken - Below clouds & pointing up
>>> Ch

Target at Multi-Year LowsTarget is low. Can it go lower? Of course.
Will it? Probably.
I am long here. I'll probably get longer.
No stop. No plan.

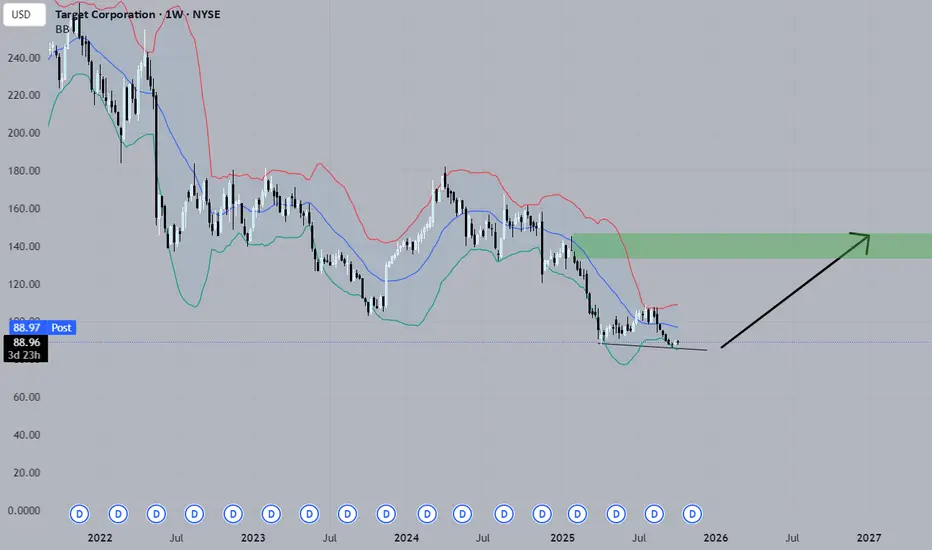
Time to Load up on TargetTarget (TGT) – Bullish Opportunity at $88.96 📈
TGT is showing a classic bullish divergence: while price has dipped, the RSI is holding higher lows, signaling potential upside momentum.
Fundamentally, Target remains strong:
High dividend yield with years of consistent payouts
New stores opening, d
See all ideas
Summarizing what the indicators are suggesting.
Neutral
SellBuy
Strong sellStrong buy
Strong sellSellNeutralBuyStrong buy
Neutral
SellBuy
Strong sellStrong buy
Strong sellSellNeutralBuyStrong buy
Neutral
SellBuy
Strong sellStrong buy
Strong sellSellNeutralBuyStrong buy
An aggregate view of professional's ratings.
Neutral
SellBuy
Strong sellStrong buy
Strong sellSellNeutralBuyStrong buy
Neutral
SellBuy
Strong sellStrong buy
Strong sellSellNeutralBuyStrong buy
Neutral
SellBuy
Strong sellStrong buy
Strong sellSellNeutralBuyStrong buy
Displays a symbol's price movements over previous years to identify recurring trends.
US87612EBF2
Target Corporation 3.625% 15-APR-2046Yield to maturity
5.66%
Maturity date
Apr 15, 2046
TGT4554193
Target Corporation 3.9% 15-NOV-2047Yield to maturity
5.62%
Maturity date
Nov 15, 2047
TGT5344011
Target Corporation 2.95% 15-JAN-2052Yield to maturity
5.58%
Maturity date
Jan 15, 2052
TGT5527761
Target Corporation 4.8% 15-JAN-2053Yield to maturity
5.56%
Maturity date
Jan 15, 2053
TGT3869508
Target Corporation 4.0% 01-JUL-2042Yield to maturity
5.40%
Maturity date
Jul 1, 2042
TGT.IJ
Target Corporation 7.0% 15-JAN-2038Yield to maturity
5.15%
Maturity date
Jan 15, 2038
TGT.ID
Target Corporation 6.5% 15-OCT-2037Yield to maturity
4.90%
Maturity date
Oct 15, 2037
TGT6035418
Target Corporation 5.0% 15-APR-2035Yield to maturity
4.82%
Maturity date
Apr 15, 2035
TGT6094660
Target Corporation 5.25% 15-FEB-2036Yield to maturity
4.77%
Maturity date
Feb 15, 2036
TGT5885569
Target Corporation 4.5% 15-SEP-2034Yield to maturity
4.72%
Maturity date
Sep 15, 2034
TGT.HW
Target Corporation 6.35% 01-NOV-2032Yield to maturity
4.48%
Maturity date
Nov 1, 2032
See all TGT bonds
Curated watchlists where TGT is featured.


Frequently Asked Questions
The current price of TGT is 93.20 USD — it has increased by 0.94% in the past 24 hours. Watch Target Corporation stock price performance more closely on the chart.
Depending on the exchange, the stock ticker may vary. For instance, on NYSE exchange Target Corporation stocks are traded under the ticker TGT.
TGT stock has risen by 2.94% compared to the previous week, the month change is a 4.39% rise, over the last year Target Corporation has showed a −30.11% decrease.
We've gathered analysts' opinions on Target Corporation future price: according to them, TGT price has a max estimate of 130.00 USD and a min estimate of 63.00 USD. Watch TGT chart and read a more detailed Target Corporation stock forecast: see what analysts think of Target Corporation and suggest that you do with its stocks.
TGT stock is 1.51% volatile and has beta coefficient of 0.77. Track Target Corporation stock price on the chart and check out the list of the most volatile stocks — is Target Corporation there?
Today Target Corporation has the market capitalization of 42.14 B, it has increased by 7.19% over the last week.
Yes, you can track Target Corporation financials in yearly and quarterly reports right on TradingView.
Target Corporation is going to release the next earnings report on Mar 10, 2026. Keep track of upcoming events with our Earnings Calendar.
TGT earnings for the last quarter are 1.78 USD per share, whereas the estimation was 1.71 USD resulting in a 4.18% surprise. The estimated earnings for the next quarter are 2.14 USD per share. See more details about Target Corporation earnings.
Target Corporation revenue for the last quarter amounts to 25.27 B USD, despite the estimated figure of 25.32 B USD. In the next quarter, revenue is expected to reach 30.50 B USD.
TGT net income for the last quarter is 689.00 M USD, while the quarter before that showed 935.00 M USD of net income which accounts for −26.31% change. Track more Target Corporation financial stats to get the full picture.
Yes, TGT dividends are paid quarterly. The last dividend per share was 1.14 USD. As of today, Dividend Yield (TTM)% is 4.86%. Tracking Target Corporation dividends might help you take more informed decisions.
Target Corporation dividend yield was 3.23% in 2024, and payout ratio reached 50.35%. The year before the numbers were 3.01% and 48.99% correspondingly. See high-dividend stocks and find more opportunities for your portfolio.
As of Dec 9, 2025, the company has 440 K employees. See our rating of the largest employees — is Target Corporation on this list?
EBITDA measures a company's operating performance, its growth signifies an improvement in the efficiency of a company. Target Corporation EBITDA is 7.81 B USD, and current EBITDA margin is 8.08%. See more stats in Target Corporation financial statements.
Like other stocks, TGT shares are traded on stock exchanges, e.g. Nasdaq, Nyse, Euronext, and the easiest way to buy them is through an online stock broker. To do this, you need to open an account and follow a broker's procedures, then start trading. You can trade Target Corporation stock right from TradingView charts — choose your broker and connect to your account.
Investing in stocks requires a comprehensive research: you should carefully study all the available data, e.g. company's financials, related news, and its technical analysis. So Target Corporation technincal analysis shows the buy rating today, and its 1 week rating is sell. Since market conditions are prone to changes, it's worth looking a bit further into the future — according to the 1 month rating Target Corporation stock shows the sell signal. See more of Target Corporation technicals for a more comprehensive analysis.
If you're still not sure, try looking for inspiration in our curated watchlists.
If you're still not sure, try looking for inspiration in our curated watchlists.