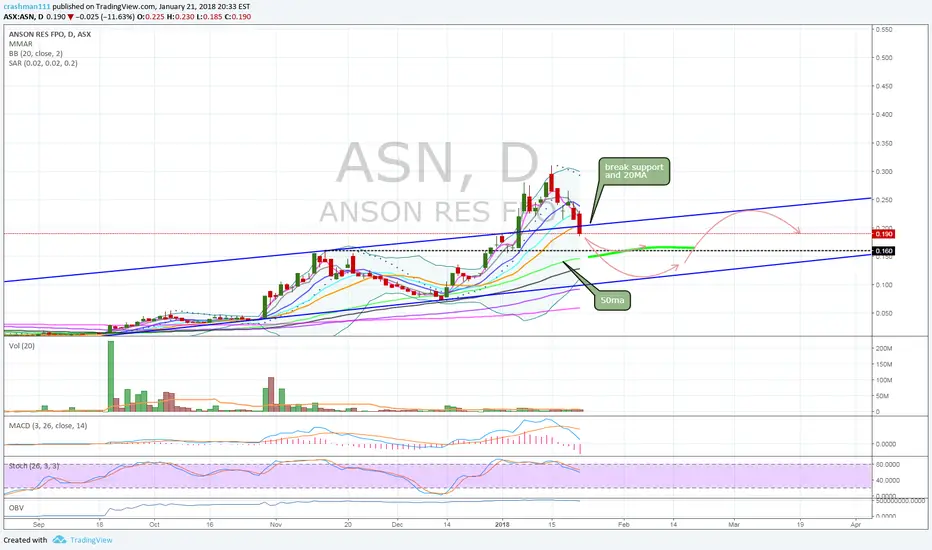
Lithium Brine Penny Stock Long HereI traded this ASX name on the OTC at its 3x breakout last year and I've kept my eye on it as it has floated slowly back down to the breakout zone. Notice the patterns in the Relative Strength Index before it broke out, and notice what it is doing now-- easing and curving up. The ASX stock has bounce
−0.0039USD
−8.28 MUSD
984.57 M
About Anson Resources
Sector
Industry
CEO
Bruce Andrew Richardson
Website
Headquarters
West Perth
Founded
2009
ISIN
AU000000ASN8
FIGI
BBG00PQCSBJ4
Anson Resources Ltd. is an exploration company, which engages in iron sand mining activities. Its projects include Paradox Brine, Ajana Graphite and Hooley Wells Nickel-Cobalt Laterite. The company was founded on April 17, 2009 and is headquartered in West Perth, Australia.

Australias Anson Resources Targeting Increase in LithiumAnson has been range trading since the end of last year and with todays announcement of plans for a major increase in planned production capacity of its core asset, the Paradox Lithium Project in Utah, USA it would seem pretty bullish.
Could be worth further research.

Anson Resources, Little Known Uranium and Battery Metal ExplorerI've been watching ANSNF coil up in a descending wedge pattern for a few days, until it broke out w/ serious momentum. I'm not one to chase, so here's to hoping the price decides to retest support before breaking out of its larger bull pennant / 3 rising valleys pattern.


(ASX:ASN) Anson Resources - Falling Wedge Breakout Inc Could retest 30c to form Inverse H&S before breakout of falling wedge structure.
Could continue its run through the final resistance of falling wedge (Red Line) and commence bull run.
Moral of the story: Watch the breakout of the red line.

$ASN third times a charmAnother bull pennant appearing on the daily chart. The formation seems ripe for some action (3 month formation + declining volume + constricting bollinger bands).
I would rate this setup a 60% chance of success due to the following reasons:
• 3 month formation
• Flag appearing above the 200ema
•

ASN Breakout ImminentWe all know lithium miners have taken a hit lately with articles published stating oversupply however I tend to disagree.
I see ASN (Anson resources) as one of the junior minors that will soon be one of the worlds richest lithium miners. Based in Utah, Anson resources is due to release their PPM re

See all ideas
Trade directly on the supercharts through our supported, fully-verified and user-reviewed brokers.


Frequently Asked Questions
The current price of ANSNF is 0.0713 USD — it has increased by 18.83% in the past 24 hours.
Depending on the exchange, the stock ticker may vary. For instance, on OTC exchange Anson Resources stocks are traded under the ticker ANSNF.
Anson Resources is going to release the next earnings report on Sep 26, 2024. Keep track of upcoming events with our Earnings Calendar.
ANSNF stock is 15.85% volatile and has beta coefficient of 0.62. Check out the list of the most volatile stocks — is Anson Resources there?
Yes, you can track Anson Resources financials in yearly and quarterly reports right on TradingView.
ANSNF stock has risen by 18.83% compared to the previous week, the month change is a 30.35% rise, over the last year Anson Resources has showed a 40.58% decrease.
ANSNF net income for the last quarter is −2.94 M USD, while the quarter before that showed −1.91 M USD of net income which accounts for −54.07% change. Track more Anson Resources financial stats to get the full picture.
Today Anson Resources has the market capitalization of 91.38 M, it has decreased by 3.61% over the last week.
No, ANSNF doesn't pay any dividends to its shareholders. But don't worry, we've prepared a list of high-dividend stocks for you.
Like other stocks, ANSNF shares are traded on stock exchanges, e.g. Nasdaq, Nyse, Euronext, and the easiest way to buy them is through an online stock broker. To do this, you need to open an account and follow a broker's procedures, then start trading. You can trade Anson Resources stock right from TradingView charts — choose your broker and connect to your account.
Investing in stocks requires a comprehensive research: you should carefully study all the available data, e.g. company's financials, related news, and its technical analysis. So Anson Resources technincal analysis shows the neutral today, and its 1 week rating is neutral. Since market conditions are prone to changes, it's worth looking a bit further into the future — according to the 1 month rating Anson Resources stock shows the sell signal. See more of Anson Resources technicals for a more comprehensive analysis.
If you're still not sure, try looking for inspiration in our curated watchlists.
If you're still not sure, try looking for inspiration in our curated watchlists.