

−0.0129USD
−6.50 MUSD
3.91 MUSD
474.28 M
About ENDEXX Corp.
Sector
Industry
CEO
Todd Allen Davis
Website
Headquarters
Cave Creek
Employees (FY)
10
Founded
1997
FIGI
BBG000BFDDZ2
Endexx Corp. engages in the development of plant-based products. The company was founded on September 5, 1997 and is headquartered in Cave Creek, AZ.

Long - EDXCLong overnight hold looking for this to pop for a nice morning spike, in and out
Good volume, multi day runner, still has more to go id say, nice small break after 2pm
Possibly a little over extended though I plan to get out early if I am wrong
OTC:EDXC

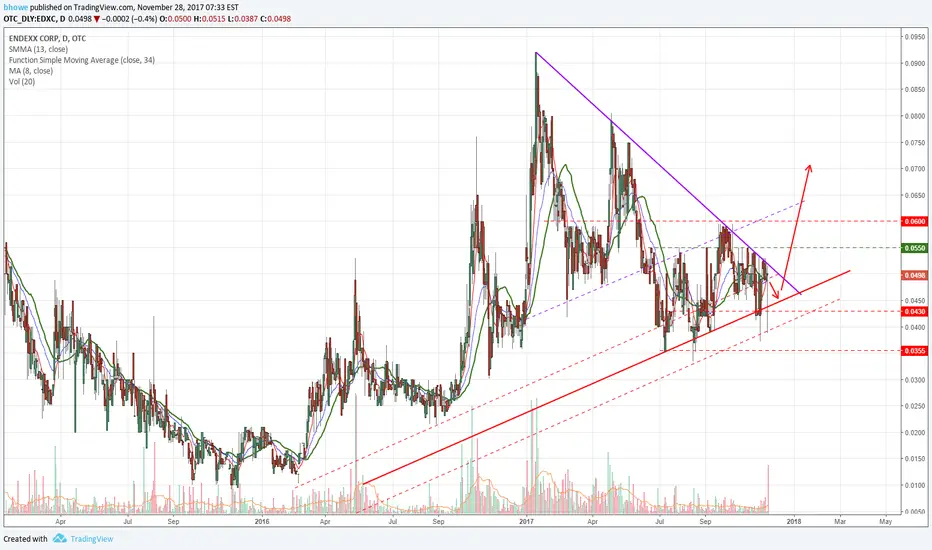
EDXC Long IdeaEDXC has been consolidating in a triangle pattern. Im looking for a breakout soon to the upside. The consolidation is getting pinched as the upper and lower trend lines converge. I set a limit order for the bottom of the lower trend line Yesterday and it hit at $0.043.
See all ideas
Trade directly on the supercharts through our supported, fully-verified and user-reviewed brokers.


Frequently Asked Questions
The current price of EDXC is 0.0217 USD — it has decreased by 1.27% in the past 24 hours.
Depending on the exchange, the stock ticker may vary. For instance, on OTC exchange ENDEXX Corp. stocks are traded under the ticker EDXC.
ENDEXX Corp. is going to release the next earnings report on May 20, 2024. Keep track of upcoming events with our Earnings Calendar.
EDXC stock is 19.70% volatile and has beta coefficient of 1.14. Check out the list of the most volatile stocks — is ENDEXX Corp. there?
Yes, you can track ENDEXX Corp. financials in yearly and quarterly reports right on TradingView.
EDXC stock has risen by 3.43% compared to the previous week, the month change is a 16.46% fall, over the last year ENDEXX Corp. has showed a 44.31% decrease.
EDXC net income for the last quarter is −2.63 M USD, while the quarter before that showed −1.84 M USD of net income which accounts for −43.24% change. Track more ENDEXX Corp. financial stats to get the full picture.
Today ENDEXX Corp. has the market capitalization of 11.14 M, it has increased by 32.72% over the last week.
No, EDXC doesn't pay any dividends to its shareholders. But don't worry, we've prepared a list of high-dividend stocks for you.
Like other stocks, EDXC shares are traded on stock exchanges, e.g. Nasdaq, Nyse, Euronext, and the easiest way to buy them is through an online stock broker. To do this, you need to open an account and follow a broker's procedures, then start trading. You can trade ENDEXX Corp. stock right from TradingView charts — choose your broker and connect to your account.
As of Apr 23, 2024, the company has 10.00 employees. See our rating of the largest employees — is ENDEXX Corp. on this list?
Investing in stocks requires a comprehensive research: you should carefully study all the available data, e.g. company's financials, related news, and its technical analysis. So ENDEXX Corp. technincal analysis shows the sell today, and its 1 week rating is sell. Since market conditions are prone to changes, it's worth looking a bit further into the future — according to the 1 month rating ENDEXX Corp. stock shows the sell signal. See more of ENDEXX Corp. technicals for a more comprehensive analysis.
If you're still not sure, try looking for inspiration in our curated watchlists.
If you're still not sure, try looking for inspiration in our curated watchlists.
EBITDA measures a company's operating performance, its growth signifies an improvement in the efficiency of a company. ENDEXX Corp. EBITDA is −5.23 M USD, and current EBITDA margin is −133.83%. See more stats in ENDEXX Corp. financial statements.