GGIGaribaldi Resources is a speculative gamble play in the Golden Triangle area . They control a significant land package there and have been in a massive 6 year declining wedge pattern .
−0.0179USD
−2.60 MUSD
103.60 M
About Garibaldi Resources Corp.
Sector
Industry
CEO
Steve Regoci
Website
Headquarters
Vancouver
Founded
1993
ISIN
CA3660441054
FIGI
BBG000MWGN24
Garibaldi Resources Corp. is an exploration stage company, which engages in the acquisition, exploration, and evaluation of mineral properties. Its projects include Eskay Creek, Palm Spring Project, King, Red Lion, Grizzly, and Otter Creek. The company was founded on November 22, 1993 and is headquartered in Vancouver, Canada.

GGI.V -- Oversold and forgotten high grade Nickel and Gold PlayGGI has hit some rough patches recently but the macro looks very favourable with lots of attention on ethical Nickel, thanks to Tesla Battery Day. The Nickel Mountain Deposit hosts some of the highest grade Nickel on the planet. The head geologist Dr. Peter Lightfoot is one of the top Nickel experts


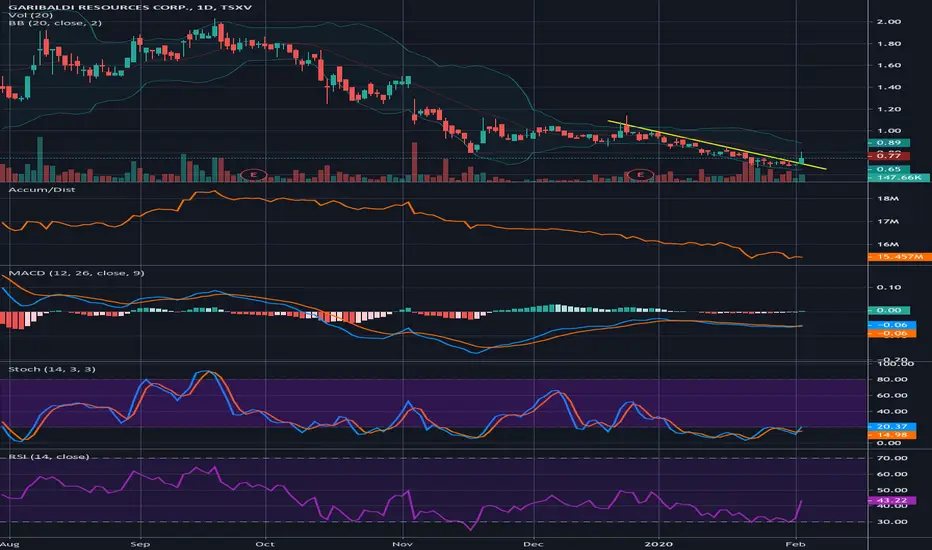
GGI.V -- Downtrend break signalling reversalGGI.V has broken the downtrend after bouncing off oversold RSI levels. Bullish MACD cross, bullish Stoch/RSI action confirming trend reversal. Long-term support band near .70 has now been tested and held 3 years in a row. I am long at .69 - .71.
GGI Weekly ChartGGI holding weekly support level at .71 . Mental stop loss at a close lower than .69 .


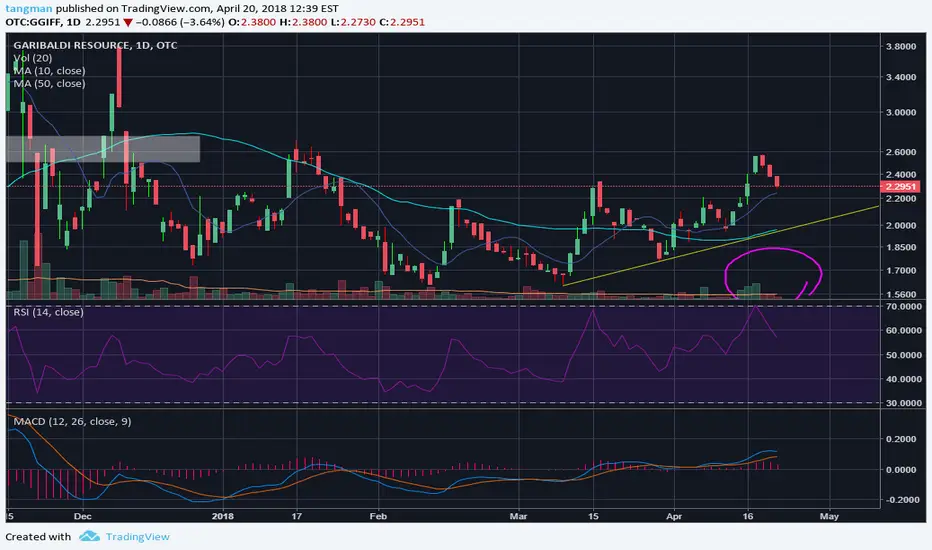
GGI Pullback- Buy now!GGI experienced a pullback in an up-trending market (Usually 3-4 days of pullback before its next move up).
Try to buy in around 2.90. I am expecting GGI to reach a level of 3.40-3.55.
Stop loss at 2.7 or approximately its trend line.

Gold looking bullishThis particular company keeps getting mentioned by Eric Sprott on his public weekly podcast.
In the last few days, we see it rallied on higher volume and has pulled back on very light volume. That should suggest short term bullishness out of this bull flag, although I think the longer term outlook
GGI Cup Pattern FormationIntermediate term. Wishful thinking perhaps but watching this develop regardless. Coincides with drill program starting at end of Q2.


See all ideas
Trade directly on the supercharts through our supported, fully-verified and user-reviewed brokers.


Frequently Asked Questions
The current price of GGIFF is 0.0600 USD — it has decreased by 14.29% in the past 24 hours.
Depending on the exchange, the stock ticker may vary. For instance, on OTC exchange Garibaldi Resources Corp. stocks are traded under the ticker GGIFF.
GGIFF stock is 16.67% volatile and has beta coefficient of 0.05. Check out the list of the most volatile stocks — is Garibaldi Resources Corp. there?
Yes, you can track Garibaldi Resources Corp. financials in yearly and quarterly reports right on TradingView.
GGIFF stock has fallen by 25.00% compared to the previous week, the month change is a 1.69% rise, over the last year Garibaldi Resources Corp. has showed a 54.20% decrease.
GGIFF net income for the last quarter is 27.52 K USD, while the quarter before that showed −167.69 K USD of net income which accounts for 116.41% change. Track more Garibaldi Resources Corp. financial stats to get the full picture.
Today Garibaldi Resources Corp. has the market capitalization of 8.97 M, it has increased by 5.79% over the last week.
No, GGIFF doesn't pay any dividends to its shareholders. But don't worry, we've prepared a list of high-dividend stocks for you.
Like other stocks, GGIFF shares are traded on stock exchanges, e.g. Nasdaq, Nyse, Euronext, and the easiest way to buy them is through an online stock broker. To do this, you need to open an account and follow a broker's procedures, then start trading. You can trade Garibaldi Resources Corp. stock right from TradingView charts — choose your broker and connect to your account.
Investing in stocks requires a comprehensive research: you should carefully study all the available data, e.g. company's financials, related news, and its technical analysis. So Garibaldi Resources Corp. technincal analysis shows the sell today, and its 1 week rating is strong sell. Since market conditions are prone to changes, it's worth looking a bit further into the future — according to the 1 month rating Garibaldi Resources Corp. stock shows the sell signal. See more of Garibaldi Resources Corp. technicals for a more comprehensive analysis.
If you're still not sure, try looking for inspiration in our curated watchlists.
If you're still not sure, try looking for inspiration in our curated watchlists.