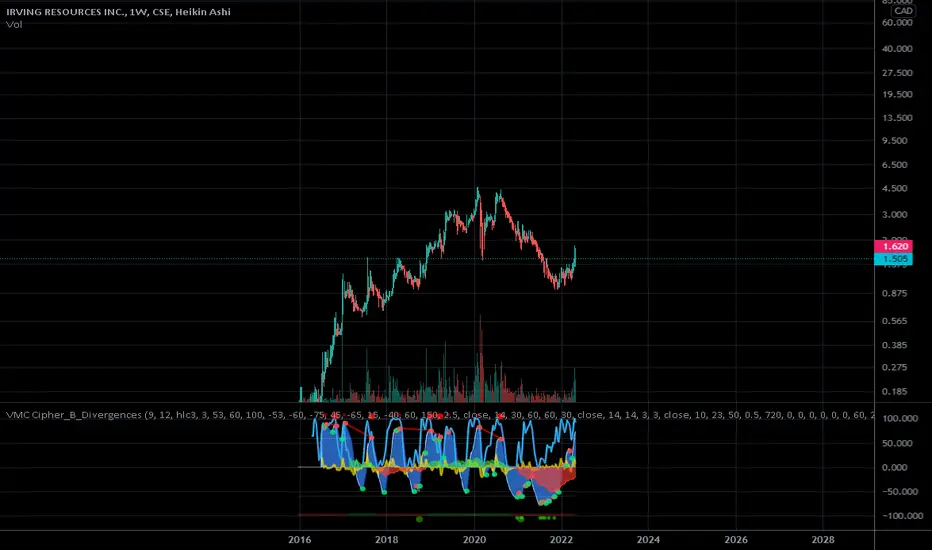
IRV 1000 X possible play Gold minerIn Peru during a Ayahuasca ceremony I saw visions of massive amounts of gold being discovered in Japan. I am betting big on IRV, Japan Gold and Bemetals. Remember that Millionaires don't use Astrology, BIllionaires do. But Trillionaires use DMT and remote viewing instead.
Trust the plan, Japanese g
−0.0228USD
−1.07 MUSD
43.56 M
About Irving Resources Inc
Sector
Industry
CEO
Akiko Levinson
Website
Headquarters
Vancouver
Founded
2015
FIGI
BBG00CMP1TG1
Irving Resources, Inc. engages in the exploration of gold. It focuses in Japan and Malawi projects. The company was founded on August 28, 2015 and is headquartered in Vancouver, Canada.

Trade directly on the supercharts through our supported, fully-verified and user-reviewed brokers.


Frequently Asked Questions
The current price of IRVRF is 0.3090 USD — it has decreased by 0.32% in the past 24 hours.
Depending on the exchange, the stock ticker may vary. For instance, on OTC exchange Irving Resources Inc stocks are traded under the ticker IRVRF.
IRVRF stock is 10.60% volatile and has beta coefficient of 2.24. Check out the list of the most volatile stocks — is Irving Resources Inc there?
Yes, you can track Irving Resources Inc financials in yearly and quarterly reports right on TradingView.
IRVRF stock has risen by 5.05% compared to the previous week, the month change is a 0.72% fall, over the last year Irving Resources Inc has showed a 65.54% decrease.
IRVRF net income for the last quarter is −338.06 K USD, while the quarter before that showed −500.99 K USD of net income which accounts for 32.52% change. Track more Irving Resources Inc financial stats to get the full picture.
Today Irving Resources Inc has the market capitalization of 21.05 M, it has decreased by 3.43% over the last week.
No, IRVRF doesn't pay any dividends to its shareholders. But don't worry, we've prepared a list of high-dividend stocks for you.
Like other stocks, IRVRF shares are traded on stock exchanges, e.g. Nasdaq, Nyse, Euronext, and the easiest way to buy them is through an online stock broker. To do this, you need to open an account and follow a broker's procedures, then start trading. You can trade Irving Resources Inc stock right from TradingView charts — choose your broker and connect to your account.
Investing in stocks requires a comprehensive research: you should carefully study all the available data, e.g. company's financials, related news, and its technical analysis. So Irving Resources Inc technincal analysis shows the buy rating today, and its 1 week rating is sell. Since market conditions are prone to changes, it's worth looking a bit further into the future — according to the 1 month rating Irving Resources Inc stock shows the sell signal. See more of Irving Resources Inc technicals for a more comprehensive analysis.
If you're still not sure, try looking for inspiration in our curated watchlists.
If you're still not sure, try looking for inspiration in our curated watchlists.