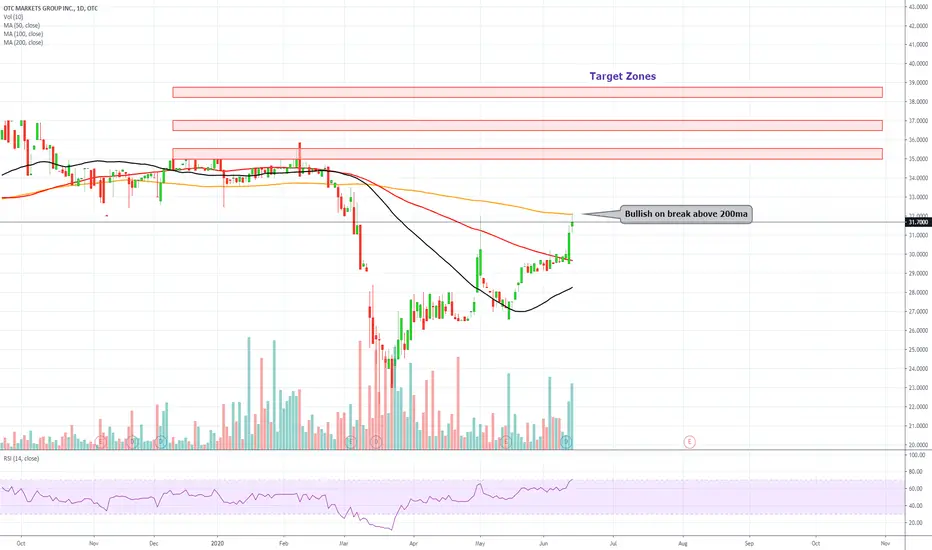
OTC Markets Group, Inc. On verge of breaking 200ma OTC Markets Group, Inc. engages in the provision of trading, corporate, and market data services. It operates through the following business lines: OTC Link LLC, market data licensing, and corporate services. The company was founded in 1904 and is headquartered in New York, NY.
2.32USD
27.05 MUSD
101.13 MUSD
6.90 M
About OTC Markets Group Inc.
Sector
Industry
CEO
R. Cromwell Coulson
Website
Headquarters
New York
Employees (FY)
134
Founded
1904
FIGI
BBG000GLZ6R4
OTC Markets Group, Inc. engages in the provision of trading, corporate, and market data services. The firm operates through the following business lines: OTC Link, Market Data Licensing and Corporate Services. The OTC Link LLC operates three ATSs, OTC Link ATS, OTC Link ECN and OTC Link NQB, which provide trading services to FINRA member broker-dealer subscribers. The Market Data Licensing provides market data and compliance data for a wide spectrum of securities and companies. The Corporate Services operates the OTCQX and OTCQB markets and offers issuers disclosure and regulatory compliance products. The company was founded in 1904 and is headquartered in New York, NY.
Trade directly on the supercharts through our supported, fully-verified and user-reviewed brokers.


Curated watchlists where OTCM is featured.

Frequently Asked Questions
The current price of OTCM is 52.80 USD — it has increased by 1.54% in the past 24 hours.
Depending on the exchange, the stock ticker may vary. For instance, on OTC exchange OTC Markets Group Inc. stocks are traded under the ticker OTCM.
OTC Markets Group Inc. is going to release the next earnings report on May 8, 2024. Keep track of upcoming events with our Earnings Calendar.
OTCM stock is 1.96% volatile and has beta coefficient of 0.43. Check out the list of the most volatile stocks — is OTC Markets Group Inc. there?
OTCM earnings for the last quarter are 0.87 USD per share, whereas the estimation was 0.62 USD resulting in a 41.46% surprise. The estimated earnings for the next quarter are 0.65 USD per share. See more details about OTC Markets Group Inc. earnings.
OTC Markets Group Inc. revenue for the last quarter amounts to 26.23 M USD despite the estimated figure of 26.68 M USD. In the next quarter revenue is expected to reach 27.77 M USD.
Yes, you can track OTC Markets Group Inc. financials in yearly and quarterly reports right on TradingView.
OTCM stock has fallen by 0.22% compared to the previous week, the month change is a 4.00% fall, over the last year OTC Markets Group Inc. has showed a 5.73% decrease.
OTCM net income for the last quarter is 6.85 M USD, while the quarter before that showed 7.22 M USD of net income which accounts for −5.11% change. Track more OTC Markets Group Inc. financial stats to get the full picture.
Today OTC Markets Group Inc. has the market capitalization of 585.78 M, it has decreased by 1.14% over the last week.
Yes, OTCM dividends are paid quarterly. The last dividend per share was 0.18 USD. As of today, Dividend Yield (TTM)% is 1.38%. Tracking OTC Markets Group Inc. dividends might help you take more informed decisions.
OTC Markets Group Inc. dividend yield was 1.29% in 2023, and payout ratio reached 31.58%. The year before the numbers were 1.27% and 28.41% correspondingly. See high-dividend stocks and find more opportunities for your portfolio.
Like other stocks, OTCM shares are traded on stock exchanges, e.g. Nasdaq, Nyse, Euronext, and the easiest way to buy them is through an online stock broker. To do this, you need to open an account and follow a broker's procedures, then start trading. You can trade OTC Markets Group Inc. stock right from TradingView charts — choose your broker and connect to your account.
As of Apr 25, 2024, the company has 134.00 employees. See our rating of the largest employees — is OTC Markets Group Inc. on this list?
Investing in stocks requires a comprehensive research: you should carefully study all the available data, e.g. company's financials, related news, and its technical analysis. So OTC Markets Group Inc. technincal analysis shows the sell today, and its 1 week rating is sell. Since market conditions are prone to changes, it's worth looking a bit further into the future — according to the 1 month rating OTC Markets Group Inc. stock shows the sell signal. See more of OTC Markets Group Inc. technicals for a more comprehensive analysis.
If you're still not sure, try looking for inspiration in our curated watchlists.
If you're still not sure, try looking for inspiration in our curated watchlists.
We've gathered analysts' opinions on OTC Markets Group Inc. future price: according to them, OTCM price has a max estimate of 68.00 USD and a min estimate of 68.00 USD. Read a more detailed OTC Markets Group Inc. forecast: see what analysts think of OTC Markets Group Inc. and suggest that you do with its stocks.
EBITDA measures a company's operating performance, its growth signifies an improvement in the efficiency of a company. OTC Markets Group Inc. EBITDA is 34.98 M USD, and current EBITDA margin is 34.60%. See more stats in OTC Markets Group Inc. financial statements.