−0.0054USD
−2.03 MUSD
3.56 MUSD
162.98 M
About Solar Alliance Energy Inc. New
Sector
Industry
CEO
Michael Clark
Website
Headquarters
Vancouver
Founded
2003
FIGI
BBG00JKHKL72
Solar Alliance Energy, Inc. engages in the provision of energy solutions. It focuses on the residential, commercial and industrial solar installations. The company was founded by Bak Jason in 2003 and is headquartered in Vancouver, Canada.


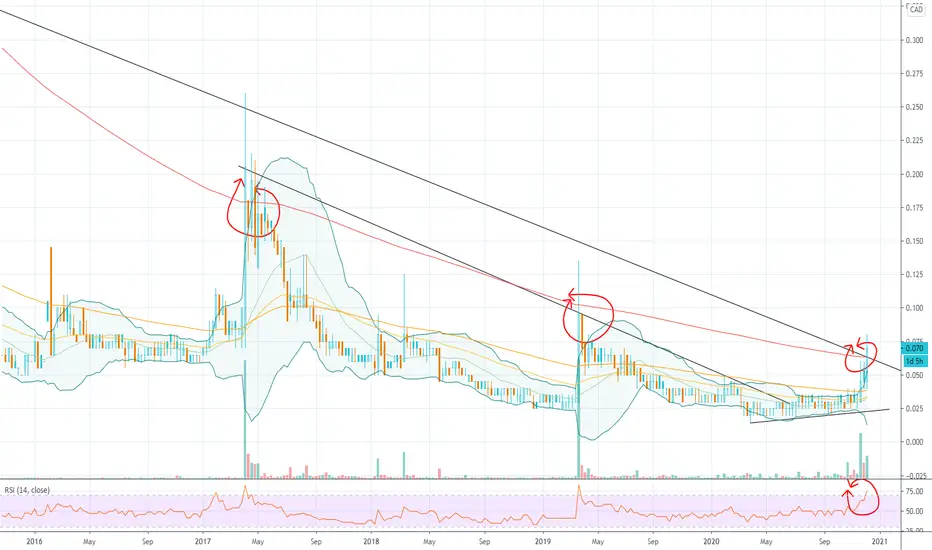
SOLR.CA: Bullish PennantBullish Flag
Pros:
Descending volume during formation
PPS above 50MA and 200MA
RS above 0, and ascending
ATR Ascending
R/R ratio above 9
250RSI above 50
Cons:
200MA flat
If confirmed:
PT = 0.95$

Solr.v on TSX Venture exchange - Up to 0.16 from closing of 0.09Trading Halt was initiated by the company for yesterdays session based on a headline today.
Very decent up-move on a headline $60 Million Project signed...will be following and no reason to sell at the moment. Has broken above resistance, will be monitoring.
finance.yahoo.com
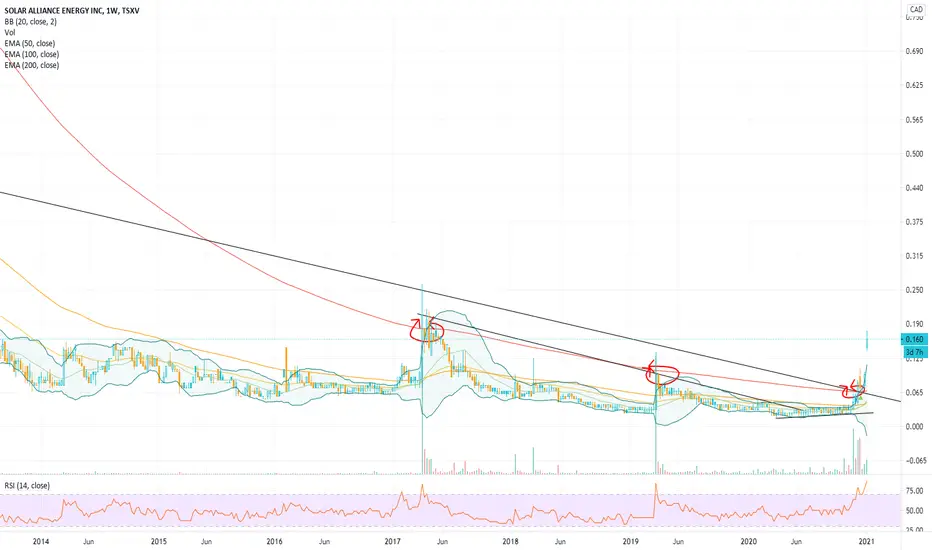
SOLR (TSX) looking Interesting for once...Maybe twice, maybe, three times. Maybe it's a charm.
A tiny part of my portfolio, been holding for over a decade, added in 2019 or was it 2018. RSI looking good. See if it wants to move above that 200 EMA weekly and stay above it, for once...Not holding my breath, but with oil on a bit of a bullish
See all ideas
Trade directly on the supercharts through our supported, fully-verified and user-reviewed brokers.


Frequently Asked Questions
The current price of SAENF is 0.0362 USD — it has decreased by 0.82% in the past 24 hours.
Depending on the exchange, the stock ticker may vary. For instance, on OTC exchange Solar Alliance Energy Inc. New stocks are traded under the ticker SAENF.
Solar Alliance Energy Inc. New is going to release the next earnings report on Apr 30, 2024. Keep track of upcoming events with our Earnings Calendar.
SAENF stock is 2.82% volatile and has beta coefficient of 1.01. Check out the list of the most volatile stocks — is Solar Alliance Energy Inc. New there?
Yes, you can track Solar Alliance Energy Inc. New financials in yearly and quarterly reports right on TradingView.
SAENF stock has risen by 2.10% compared to the previous week, the month change is a 17.73% fall, over the last year Solar Alliance Energy Inc. New has showed a 29.30% decrease.
SAENF net income for the last quarter is 718.22 K USD, while the quarter before that showed −181.45 K USD of net income which accounts for 495.83% change. Track more Solar Alliance Energy Inc. New financial stats to get the full picture.
Today Solar Alliance Energy Inc. New has the market capitalization of 9.99 M, it has increased by 9.90% over the last week.
No, SAENF doesn't pay any dividends to its shareholders. But don't worry, we've prepared a list of high-dividend stocks for you.
Like other stocks, SAENF shares are traded on stock exchanges, e.g. Nasdaq, Nyse, Euronext, and the easiest way to buy them is through an online stock broker. To do this, you need to open an account and follow a broker's procedures, then start trading. You can trade Solar Alliance Energy Inc. New stock right from TradingView charts — choose your broker and connect to your account.
Investing in stocks requires a comprehensive research: you should carefully study all the available data, e.g. company's financials, related news, and its technical analysis. So Solar Alliance Energy Inc. New technincal analysis shows the sell today, and its 1 week rating is sell. Since market conditions are prone to changes, it's worth looking a bit further into the future — according to the 1 month rating Solar Alliance Energy Inc. New stock shows the sell signal. See more of Solar Alliance Energy Inc. New technicals for a more comprehensive analysis.
If you're still not sure, try looking for inspiration in our curated watchlists.
If you're still not sure, try looking for inspiration in our curated watchlists.
EBITDA measures a company's operating performance, its growth signifies an improvement in the efficiency of a company. Solar Alliance Energy Inc. New EBITDA is −1.55 M USD, and current EBITDA margin is −78.68%. See more stats in Solar Alliance Energy Inc. New financial statements.