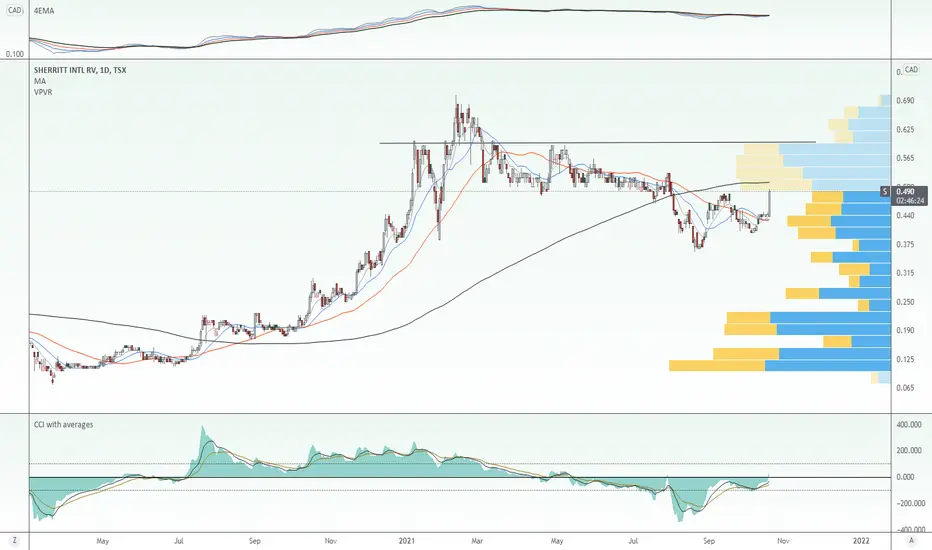
SherritNickel , new aggressive management, big volume, nickel spot all time highs, ev battery used heavily
−0.1227USD
−48.74 MUSD
168.48 MUSD
394.86 M
About Sherritt International Corp.
Sector
Industry
CEO
Leon Binedell
Website
Headquarters
Toronto
Founded
1927
ISIN
CA8239011031
FIGI
BBG000N66CJ7
Sherritt International Corp. engages in the production and provision of nickel and cobalt from lateritic ores. It operates through the following segments: Metals, Power, Technologies, Oil and Gas, and Corporate. The Metals segments focuses on mining, processing, and refining activities of nickel and cobalt. The Power segment refers to the power operations in Cuba. The Technologies segment represents the technology group which delivers technical support, process optimization, and technology development services. The Oil and Gas segment is involved in exploring oil and gas mainly from reservoirs located offshore and provides drilling services for third parties. The Corporate segment includes overall management and general corporate activities related to public companies, including business and market development, management of cash, publicly traded debt, and government relations. The company was founded on July 5, 1927 and is headquartered in Toronto, Canada.

Nickelanother view, sometimes a b/o can work and at times price will fall and ride down the rail before going up, dollar dependent for direction also, dollar down = commods up

SherrittH & S played out and good push thru today but into volume block, insiders have been buying. Nickel supplier plus other stuff

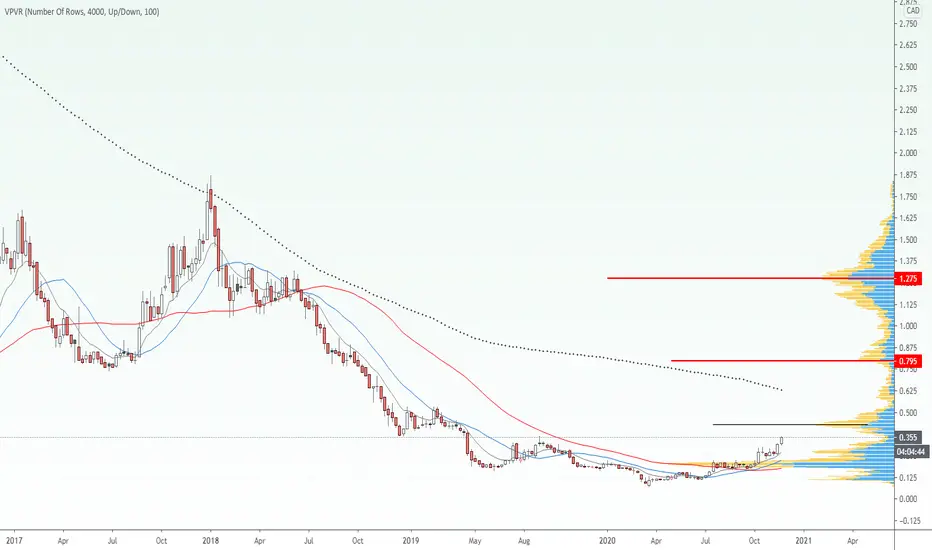
S.TO Inverse H&SSherritt Intl. is in a breakout after an inverse head and shoulder pattern and high volume; target of $0.80.

S looking superbSherritt continues to push higher. Based on previous algo results, we discuss the next potential top


See all ideas
Trade directly on the supercharts through our supported, fully-verified and user-reviewed brokers.


Frequently Asked Questions
The current price of SHERF is 0.2370 USD — it has decreased by 11.90% in the past 24 hours.
Depending on the exchange, the stock ticker may vary. For instance, on OTC exchange Sherritt International Corp. stocks are traded under the ticker SHERF.
Sherritt International Corp. is going to release the next earnings report on May 8, 2024. Keep track of upcoming events with our Earnings Calendar.
SHERF stock is 13.50% volatile and has beta coefficient of 0.11. Check out the list of the most volatile stocks — is Sherritt International Corp. there?
One year price forecast for Sherritt International Corp. has a max estimate of 0.5808 USD and a min estimate of 0.3630 USD.
SHERF earnings for the last quarter are −0.04 USD per share, whereas the estimation was −0.03 USD resulting in a −15.39% surprise. The estimated earnings for the next quarter are −0.06 USD per share. See more details about Sherritt International Corp. earnings.
Sherritt International Corp. revenue for the last quarter amounts to 26.79 M USD despite the estimated figure of 24.29 M USD. In the next quarter revenue is expected to reach 32.82 M USD.
Yes, you can track Sherritt International Corp. financials in yearly and quarterly reports right on TradingView.
SHERF stock has fallen by 11.90% compared to the previous week, the month change is a 14.66% rise, over the last year Sherritt International Corp. has showed a 45.92% decrease.
SHERF net income for the last quarter is −40.29 M USD, while the quarter before that showed −18.26 M USD of net income which accounts for −120.70% change. Track more Sherritt International Corp. financial stats to get the full picture.
Today Sherritt International Corp. has the market capitalization of 93.75 M, it has increased by 8.68% over the last week.
No, SHERF doesn't pay any dividends to its shareholders. But don't worry, we've prepared a list of high-dividend stocks for you.
Like other stocks, SHERF shares are traded on stock exchanges, e.g. Nasdaq, Nyse, Euronext, and the easiest way to buy them is through an online stock broker. To do this, you need to open an account and follow a broker's procedures, then start trading. You can trade Sherritt International Corp. stock right from TradingView charts — choose your broker and connect to your account.
Investing in stocks requires a comprehensive research: you should carefully study all the available data, e.g. company's financials, related news, and its technical analysis. So Sherritt International Corp. technincal analysis shows the neutral today, and its 1 week rating is sell. Since market conditions are prone to changes, it's worth looking a bit further into the future — according to the 1 month rating Sherritt International Corp. stock shows the sell signal. See more of Sherritt International Corp. technicals for a more comprehensive analysis.
If you're still not sure, try looking for inspiration in our curated watchlists.
If you're still not sure, try looking for inspiration in our curated watchlists.
We've gathered analysts' opinions on Sherritt International Corp. future price: according to them, SHERF price has a max estimate of 0.58 USD and a min estimate of 0.36 USD. Read a more detailed Sherritt International Corp. forecast: see what analysts think of Sherritt International Corp. and suggest that you do with its stocks.
EBITDA measures a company's operating performance, its growth signifies an improvement in the efficiency of a company. Sherritt International Corp. EBITDA is −37.27 M USD, and current EBITDA margin is −22.12%. See more stats in Sherritt International Corp. financial statements.