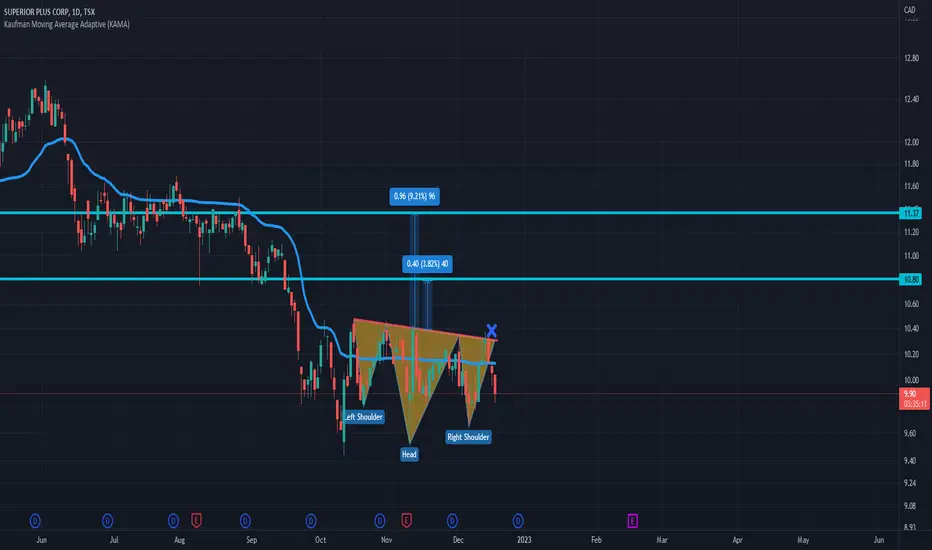
SPB // Inverted shoulder-to-shoulder formationLet's look for closures where I indicated with X. The targets are determined according to Fibonacci.
0.24USD
38.93 MUSD
2.53 BUSD
222.75 M
About Superior Plus Corp.
Sector
Industry
CEO
Allan MacDonald
Website
Headquarters
Toronto
Founded
1996
ISIN
CA86828P1036
FIGI
BBG000NZY3W7
Superior Plus Corp. engages in the provision of propane distribution, specialty chemicals, construction products distribution, and fixed price energy services. It operates through the following business segments: U.S. Retail Propane Distribution (U.S. Propane), Canadian Retail Propane Distribution (Canadian Propane), and North American Wholesale Propane Distribution (Wholesale Propane). The U.S. Propane segment distributes propane gas and liquid fuels primarily in the Eastern United States. The Canadian Propane segment includes distribution of propane gas and liquid fuels across Canada to residential, and commercial customers. The Wholesale Propane segment refers to the distribution and marketing of propane gas and other natural gas liquids across Canada, and the U.S. to wholesale customers. The company was founded on August 2, 1996 and is headquartered in Toronto, Canada.

Trade directly on the supercharts through our supported, fully-verified and user-reviewed brokers.


Frequently Asked Questions
The current price of SUUIF is 6.87 USD — it has increased by 1.18% in the past 24 hours.
Depending on the exchange, the stock ticker may vary. For instance, on OTC exchange Superior Plus Corp. stocks are traded under the ticker SUUIF.
Superior Plus Corp. is going to release the next earnings report on May 14, 2024. Keep track of upcoming events with our Earnings Calendar.
SUUIF stock is 1.16% volatile and has beta coefficient of 0.97. Check out the list of the most volatile stocks — is Superior Plus Corp. there?
One year price forecast for Superior Plus Corp. has a max estimate of 11.08 USD and a min estimate of 8.49 USD.
SUUIF earnings for the last quarter are −0.34 USD per share, whereas the estimation was −0.20 USD resulting in a −71.28% surprise. The estimated earnings for the next quarter are 0.21 USD per share. See more details about Superior Plus Corp. earnings.
Superior Plus Corp. revenue for the last quarter amounts to 390.87 M USD despite the estimated figure of 534.47 M USD. In the next quarter revenue is expected to reach 939.30 M USD.
Yes, you can track Superior Plus Corp. financials in yearly and quarterly reports right on TradingView.
SUUIF stock has fallen by 1.15% compared to the previous week, the month change is a 6.40% fall, over the last year Superior Plus Corp. has showed a 15.08% decrease.
SUUIF net income for the last quarter is 53.64 M USD, while the quarter before that showed −83.99 M USD of net income which accounts for 163.87% change. Track more Superior Plus Corp. financial stats to get the full picture.
Today Superior Plus Corp. has the market capitalization of 1.70 B, it has decreased by 0.40% over the last week.
Yes, SUUIF dividends are paid quarterly. The last dividend per share was 0.13 USD. As of today, Dividend Yield (TTM)% is 7.66%. Tracking Superior Plus Corp. dividends might help you take more informed decisions.
Like other stocks, SUUIF shares are traded on stock exchanges, e.g. Nasdaq, Nyse, Euronext, and the easiest way to buy them is through an online stock broker. To do this, you need to open an account and follow a broker's procedures, then start trading. You can trade Superior Plus Corp. stock right from TradingView charts — choose your broker and connect to your account.
Investing in stocks requires a comprehensive research: you should carefully study all the available data, e.g. company's financials, related news, and its technical analysis. So Superior Plus Corp. technincal analysis shows the sell today, and its 1 week rating is strong sell. Since market conditions are prone to changes, it's worth looking a bit further into the future — according to the 1 month rating Superior Plus Corp. stock shows the strong sell signal. See more of Superior Plus Corp. technicals for a more comprehensive analysis.
If you're still not sure, try looking for inspiration in our curated watchlists.
If you're still not sure, try looking for inspiration in our curated watchlists.
We've gathered analysts' opinions on Superior Plus Corp. future price: according to them, SUUIF price has a max estimate of 11.08 USD and a min estimate of 8.49 USD. Read a more detailed Superior Plus Corp. forecast: see what analysts think of Superior Plus Corp. and suggest that you do with its stocks.
EBITDA measures a company's operating performance, its growth signifies an improvement in the efficiency of a company. Superior Plus Corp. EBITDA is 455.34 M USD, and current EBITDA margin is 17.99%. See more stats in Superior Plus Corp. financial statements.