$SALM norwayLooks like 5 waves complete with ending diagonal in C of 5 of 5 .. Cannot find any news accompanying except supposedly successful CEO steps down after only few months
2.12USD
278.72 MUSD
2.77 BUSD
51.03 M
About Salmar ASA
Sector
CEO
Frode Arntsen
Headquarters
Kverva
Website
Founded
1991
ISIN
NO0010310956
FIGI
BBG00KY0R6F8
SalMar ASA engages in processing and trading of fish and shellfish and other related financial activities. It operates through the following segments: Fish Farming Central Norway, Fish Farming Northern Norway, Sales and Industry, and Icelandic Salmon. The Fish Farming Central Norway segment controls 68 marine-phase production licenses, and operates several research and development licenses in collaboration with other companies. The Fish Farming Northern Norway segment holds 32 licenses for the production of farmed salmon. The Icelandic Salmon segment produces and processes farms salmon. The Sales and Industry segment administers the Group’s sales activities and harvesting and processing activities in Norway. The company was founded by Gustav Witzoe in February 1991 and is headquartered in Kverva, Norway.


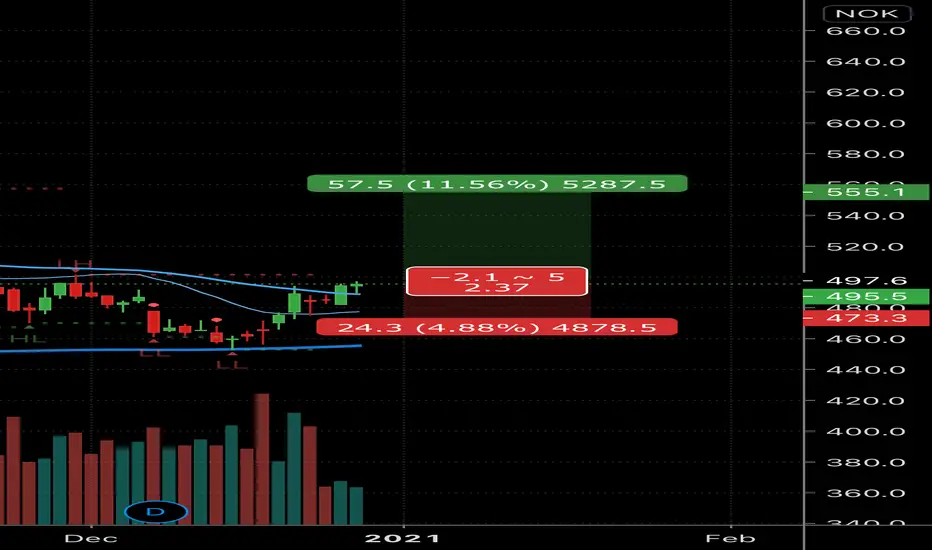
Salmar [SALM] Still consolidatingSalmar - Which is a Norwegian salmon company, has been consolidating in a roughly 15% price range the last weeks.
Personally have I caught all but one of the ranges, and now it's back at the bottom so I thought I'd share it with you all.
Price has been going back and forth from NOK - NOK for a

See all ideas
Trade directly on the supercharts through our supported, fully-verified and user-reviewed brokers.


Frequently Asked Questions
The current price of SALRF is 63.97 USD — it has increased by 3.85% in the past 24 hours.
Depending on the exchange, the stock ticker may vary. For instance, on OTC exchange Salmar ASA stocks are traded under the ticker SALRF.
Salmar ASA is going to release the next earnings report on May 14, 2024. Keep track of upcoming events with our Earnings Calendar.
SALRF stock is 3.71% volatile and has beta coefficient of 0.92. Check out the list of the most volatile stocks — is Salmar ASA there?
One year price forecast for Salmar ASA has a max estimate of 74.52 USD and a min estimate of 58.17 USD.
SALRF earnings for the last quarter are 0.71 USD per share, whereas the estimation was 0.58 USD resulting in a 21.55% surprise. The estimated earnings for the next quarter are 0.80 USD per share. See more details about Salmar ASA earnings.
Salmar ASA revenue for the last quarter amounts to 701.77 M USD despite the estimated figure of 742.39 M USD. In the next quarter revenue is expected to reach 881.42 M USD.
Yes, you can track Salmar ASA financials in yearly and quarterly reports right on TradingView.
SALRF stock has risen by 6.17% compared to the previous week, the month change is a 6.17% rise, over the last year Salmar ASA has showed a 55.21% increase.
SALRF net income for the last quarter is 129.20 M USD, while the quarter before that showed 59.04 M USD of net income which accounts for 118.83% change. Track more Salmar ASA financial stats to get the full picture.
Today Salmar ASA has the market capitalization of 7.76 B, it has increased by 1.68% over the last week.
Yes, SALRF dividends are paid annually. The last dividend per share was 1.86 USD. As of today, Dividend Yield (TTM)% is 3.07%. Tracking Salmar ASA dividends might help you take more informed decisions.
Salmar ASA dividend yield was 6.15% in 2023, and payout ratio reached 143.44%. The year before the numbers were 5.20% and 72.34% correspondingly. See high-dividend stocks and find more opportunities for your portfolio.
Like other stocks, SALRF shares are traded on stock exchanges, e.g. Nasdaq, Nyse, Euronext, and the easiest way to buy them is through an online stock broker. To do this, you need to open an account and follow a broker's procedures, then start trading. You can trade Salmar ASA stock right from TradingView charts — choose your broker and connect to your account.
Investing in stocks requires a comprehensive research: you should carefully study all the available data, e.g. company's financials, related news, and its technical analysis. So Salmar ASA technincal analysis shows the strong buy rating today, and its 1 week rating is strong buy. Since market conditions are prone to changes, it's worth looking a bit further into the future — according to the 1 month rating Salmar ASA stock shows the strong buy signal. See more of Salmar ASA technicals for a more comprehensive analysis.
If you're still not sure, try looking for inspiration in our curated watchlists.
If you're still not sure, try looking for inspiration in our curated watchlists.
We've gathered analysts' opinions on Salmar ASA future price: according to them, SALRF price has a max estimate of 74.52 USD and a min estimate of 58.17 USD. Read a more detailed Salmar ASA forecast: see what analysts think of Salmar ASA and suggest that you do with its stocks.
EBITDA measures a company's operating performance, its growth signifies an improvement in the efficiency of a company. Salmar ASA EBITDA is 821.72 M USD, and current EBITDA margin is 29.67%. See more stats in Salmar ASA financial statements.