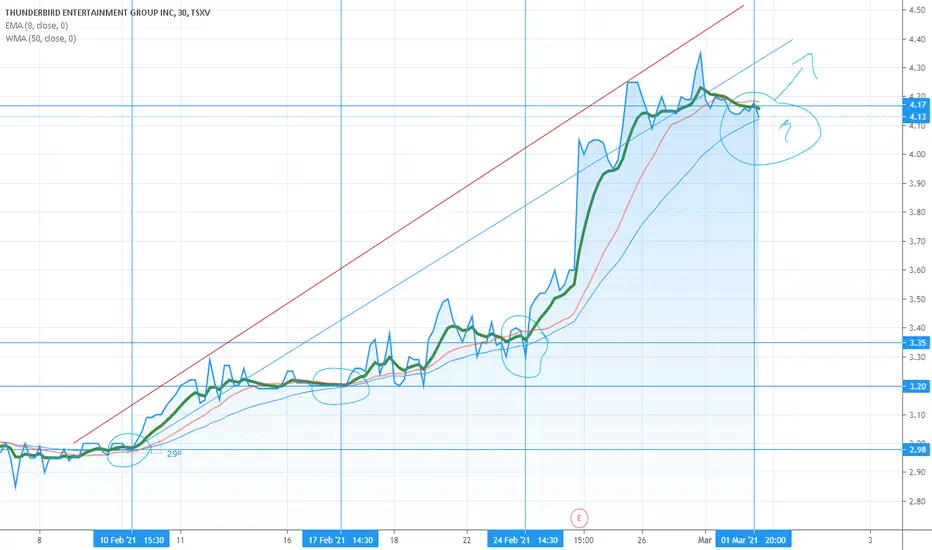
Thunderbird is the word and you're light as a feather Am I in this stock...no...sadly I've been watching it since $2 and have still failed to join. What to come for Thunderbird though? Good things...all good things.
My lazy eye spotted the ma pattern and decided to throw up a chart. I think that it's set for it's next leg up. If I'm right...it will
−0.07USD
−3.78 MUSD
125.78 MUSD
40.60 M
About Thunderbird Entertainment Group Inc.
Sector
Industry
CEO
Jennifer Twiner McCarron
Website
Headquarters
Vancouver
Founded
1969
ISIN
CA88605U1075
FIGI
BBG00N6WF381
Thunderbird Entertainment Group, Inc. engages in the multi-platform media production, distribution, and rights management. The firm is also involved in the development, production, and distribution of film and television programming for domestic and international markets. It creates scripted, factual, and animated programming for direct-to-consumer platforms. The company was founded on April 25, 1969 and is headquartered in Vancouver, Canada.
Trade directly on the supercharts through our supported, fully-verified and user-reviewed brokers.


Frequently Asked Questions
The current price of THBRF is 1.50 USD — it has decreased by 1.97% in the past 24 hours.
Depending on the exchange, the stock ticker may vary. For instance, on OTC exchange Thunderbird Entertainment Group Inc. stocks are traded under the ticker THBRF.
Thunderbird Entertainment Group Inc. is going to release the next earnings report on May 23, 2024. Keep track of upcoming events with our Earnings Calendar.
THBRF stock is 2.01% volatile and has beta coefficient of 0.27. Check out the list of the most volatile stocks — is Thunderbird Entertainment Group Inc. there?
One year price forecast for Thunderbird Entertainment Group Inc. has a max estimate of 2.41 USD and a min estimate of 2.41 USD.
THBRF earnings for the last quarter are −0.01 USD whereas the estimation was 0.01 USD which accounts for −220.00% surprise. Estimated earnings for the next quarter are 0.01 USD. See more details about Thunderbird Entertainment Group Inc. earnings.
Thunderbird Entertainment Group Inc. revenue for the last quarter amounts to 24.73 M USD despite the estimated figure of 32.13 M USD. In the next quarter revenue is expected to reach 37.29 M USD.
Yes, you can track Thunderbird Entertainment Group Inc. financials in yearly and quarterly reports right on TradingView.
THBRF stock has fallen by 7.41% compared to the previous week, the last month showed zero change in price, over the last year Thunderbird Entertainment Group Inc. has showed a 46.04% decrease.
THBRF net income for the last quarter is 467.04 K USD, while the quarter before that showed −535.14 K USD of net income which accounts for 187.27% change. Track more Thunderbird Entertainment Group Inc. financial stats to get the full picture.
Today Thunderbird Entertainment Group Inc. has the market capitalization of 77.61 M, it has increased by 6.03% over the last week.
No, THBRF doesn't pay any dividends to its shareholders. But don't worry, we've prepared a list of high-dividend stocks for you.
Like other stocks, THBRF shares are traded on stock exchanges, e.g. Nasdaq, Nyse, Euronext, and the easiest way to buy them is through an online stock broker. To do this, you need to open an account and follow a broker's procedures, then start trading. You can trade Thunderbird Entertainment Group Inc. stock right from TradingView charts — choose your broker and connect to your account.
Investing in stocks requires a comprehensive research: you should carefully study all the available data, e.g. company's financials, related news, and its technical analysis. So Thunderbird Entertainment Group Inc. technincal analysis shows the sell today, and its 1 week rating is sell. Since market conditions are prone to changes, it's worth looking a bit further into the future — according to the 1 month rating Thunderbird Entertainment Group Inc. stock shows the sell signal. See more of Thunderbird Entertainment Group Inc. technicals for a more comprehensive analysis.
If you're still not sure, try looking for inspiration in our curated watchlists.
If you're still not sure, try looking for inspiration in our curated watchlists.
We've gathered analysts' opinions on Thunderbird Entertainment Group Inc. future price: according to them, THBRF price has a max estimate of 2.41 USD and a min estimate of 2.41 USD. Read a more detailed Thunderbird Entertainment Group Inc. forecast: see what analysts think of Thunderbird Entertainment Group Inc. and suggest that you do with its stocks.
EBITDA measures a company's operating performance, its growth signifies an improvement in the efficiency of a company. Thunderbird Entertainment Group Inc. EBITDA is 18.16 M USD, and current EBITDA margin is 21.81%. See more stats in Thunderbird Entertainment Group Inc. financial statements.