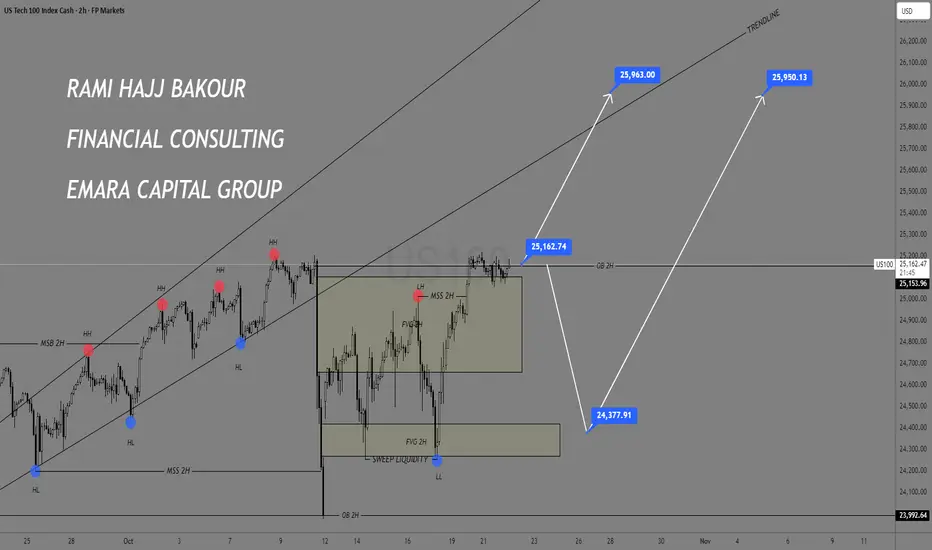
NASDAQ 100 (US100) Technical Analysis
The Nasdaq is moving within a rising channel on the 2H timeframe, after sweeping liquidity from previous lows and rebounding from the FVG 2H demand zone.
The likely scenario is a continuation of the bullish move toward 25,960 – 26,000, aligning with the upper trendline and potential resistance area.
However, a failure to hold above 25,160 may trigger a corrective pullback toward 24,380 before any renewed bullish momentum.
📊 Fundamental Outlook:
The Nasdaq remains supported by stable U.S. bond yields and easing Fed tightening expectations, along with positive earnings from major tech firms.
However, slower growth in parts of the tech sector and upcoming inflation data could temporarily limit further upside momentum.
📅 Short-term Bias: Bullish
🎯 Upside Targets: 25,960 – 26,000
📉 Pullback Target: 24,380
⛔ Invalidation Level: Below 23,990
#US100 #NASDAQ #TechnicalAnalysis #EmaraCapital #Rami_Hajj_Bakour #Trading #Markets
Trade ideas
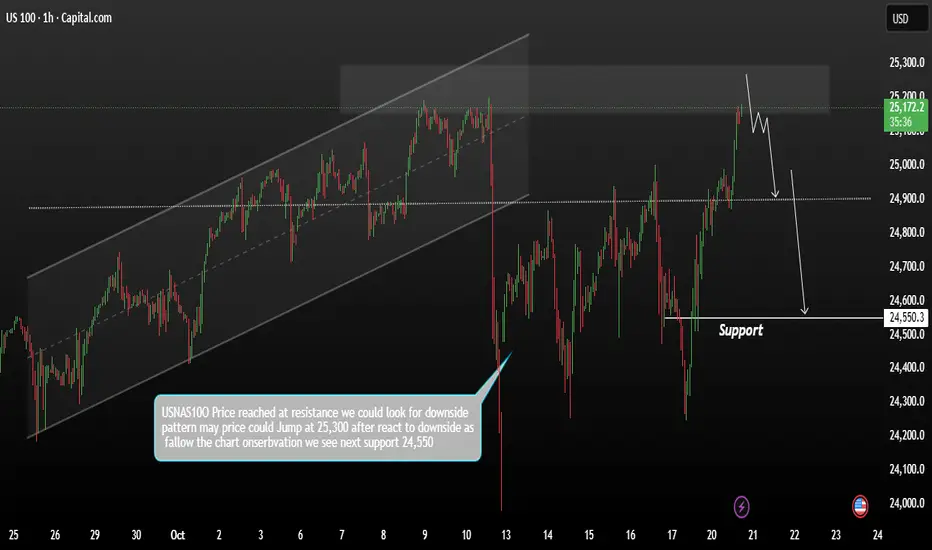
USNASDAQ100 Consolidation to downside correctionThe NASDAQ 100 started the week on solid ground, supported by gains in mega-cap stocks. However, investor sentiment remains cautious ahead of a wave of corporate earnings and a critical inflation report, both of which could determine the next major market move.
🔍 Outlook
If sellers maintain control, the USNAS100 could correct toward 25,300 initially. A break below this level would open the door toward the 24,550 support area. However, a rebound from 25,300 could trigger a short-term recovery — but the broader outlook remains bearish unless price regains ground above 26,000.
You may find more details in the chart.
Trade wisely best of Luck Buddies.
Ps; Support with like and comments for better analysis Thanks for Supporting.
USNAS100 | Bearish Momentum After Tesla Earnings MissUSNAS100 | Bearish Momentum After Tesla Earnings Miss ⚠️
The index dropped sharply by 1.5% (~500 points), exactly as projected.
Currently, the bias remains bearish while trading below 24860, with the next downside targets at 24760 → 24510.
Key Levels:
Pivot: 24,860
Resistance: 24,960 · 25,035 · 25,200
Support: 24,760 · 24,510 · 24,350
Trading Plan:
Sell Setup: Shorts remain valid below 24,860, targeting 24,760 / 24,510 / 24,350.
Buy Setup: Longs active only above 24,860, with confirmation toward 25,035 / 25,200.
Premium Takeaway
USNAS100 maintains a bearish bias below 24,860, with room to extend toward 24,510–24,350.
Only a confirmed 1H close above 25,035 would shift momentum bullish, signaling recovery toward 25,200.
previous idea:

USNASDEQ100 currently showing bearish momentumThe US NASDAQ 100 is currently showing bearish momentum after recent downside consolidation. The index remains under selling pressure following disappointing earnings reports particularly from Netflix — which dampened risk sentiment.
Additionally, reports suggesting that the Trump administration is considering new export restrictions on China involving U.S. software have further weighed on market confidence may price test the Around 25,000, where reactions could occur. If selling pressure continues, the next major support could be near 24,500.
You may find more details in the chart.
Trade wisely best of Luck Buddies.
Ps; Support with like and comments for better analysis Thanks for Suppooritng.

Nasdaq Faces Bearish Correction Below 25,180 After Recent HighsUSNAS100 | Overview
The Nasdaq is showing signs of bearish correction after stabilizing below 25,180, suggesting a potential pullback toward 25,035.
A 1H close below 25,035 would confirm further downside toward 24,960 → 24,860.
On the other hand, stability above 25,035 would support renewed bullish momentum, especially if price breaks 25,230, opening the way toward 25,400 and potentially 25,550.
Pivot Line: 25,180
Support: 25,035 · 24,960 · 24,860
Resistance: 25,300 · 25,400 · 25,550

NASDAQ Short There is a lot of resistance, as it is at an all-time high and is unable to break this level
There are 2 patterns on M15 and M30 showing a potential reversal zone
This is against the H4 trend; however, it is overbought on H1
RSI is showing strong divergence with a triple top on H1
Stoploss above 21300
First target 24870 or when M15 is oversold

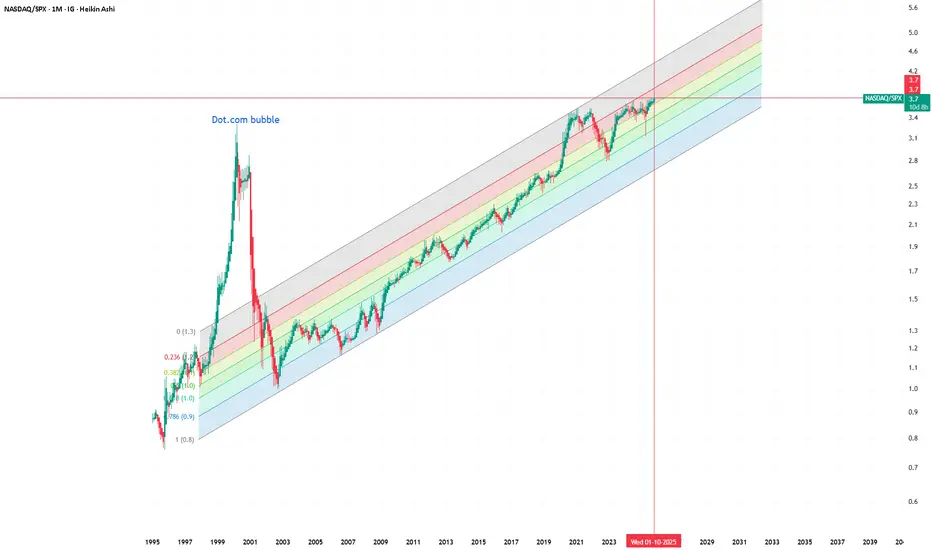
NASDAQ/SPX – Are We Really in an AI Bubble?This chart compares NASDAQ to the S&P 500 (NASDAQ/SPX) on a monthly timeframe, visualized with Heikin Ashi candles and a logarithmic regression channel for long-term context. It highlights the dot-com bubble, where the ratio reached extreme overvaluation levels far above the regression mean.
Recently, many investors have been calling the current market an “AI bubble.” However, when viewed through this historical lens, the ratio still remains within the long-term growth channel and far below the excesses of the early 2000s. This perspective suggests that, at least relative to the broader market, tech doesn’t appear to be in bubble territory yet.
It would still be valuable to compare the composition of the NASDAQ today versus in 2000, as the market structure has changed dramatically — with more diversified revenue streams, profitability, and balance sheet strength. Without this data, one can only speculate. But visually, this ratio helps challenge the popular narrative of an ongoing bubble and invites a more nuanced discussion about valuation, innovation cycles, and sector dominance.
#NASDAQ #SPX #Macro #Tech #AIbubble #DotCom #LongTerm #RatioAnalysis #HeikinAshi #MarketCycle
Nasdaq short I think nq is going to go down and a retest in to that lower area is needed for a refuel to the upside.

USNAS100 – Overview | Bearish Correction From ATH ZoneUSNAS100 – Overview | Bearish Correction From ATH Zone
USNAS100 reached a new all-time high but has now stabilized below the supply zone, suggesting a bearish correction phase.
As long as price stays below 25,180, the index remains under pressure toward 25,035 → 24,960 → 24,860.
🕯 Technical View
A 1H close above 25,230 would shift momentum bullish, targeting 25,400 → 25,600.
Pivot: 25,180
Bias: Bearish below 25,180

NAS100 short (quick trade) learningNAS100 looks stuck on the 25,150 range it will fall a bit lower and regain the strength to push above the resistance.

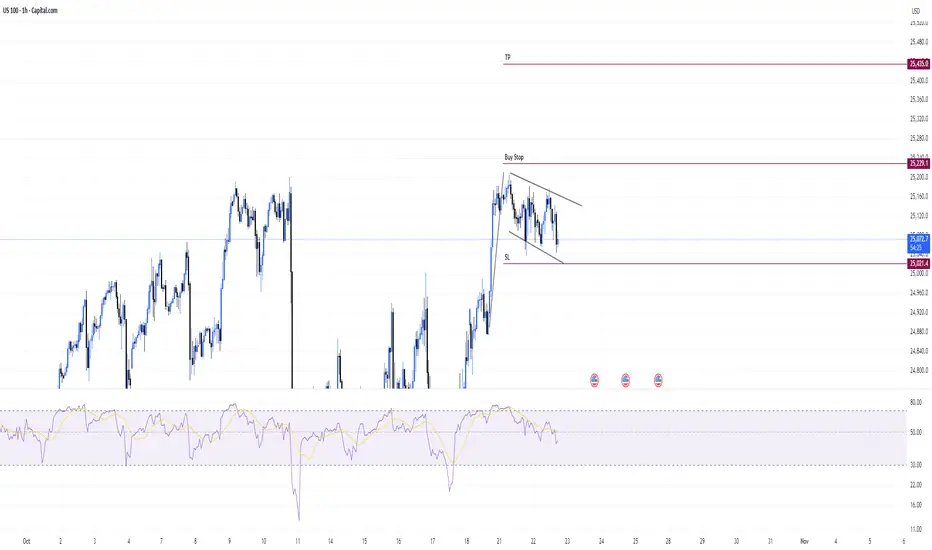
NASDAQ Flag Pattern SetupThe NASDAQ is currently forming a bullish flag pattern. If the price breaks above the flag structure, a Buy Stop order will be placed.
🔹 Entry: On breakout of the flag
🔹 Stop Loss: Below the most recent price low
🔹 Risk to Reward Ratio: 1:1
US NAS 100Preferably suitable for scalping and accurate as long as you watch carefully the price action with the drawn areas.
With your likes and comments, you give me enough energy to provide the best analysis on an ongoing basis.
And if you needed any analysis that was not on the page, you can ask me with a comment or a personal message.
Enjoy Trading ;)

Nas100 Trade Set Up Oct 22 2025Price has swept PDH and a daily BSL with a closure under leaving lots of SSL levels and daily FVG that i will target for sells after BSL being swept on the 15m

NQ SHORTShorting NQ from h4 ote anticipating wed reversal, no news today, short before the news , D crt third candle.

selling offHigh risk low reward entry as price is showing of signs of slowing down it is still bullish. looking at the previous HTF HL areas are target places.

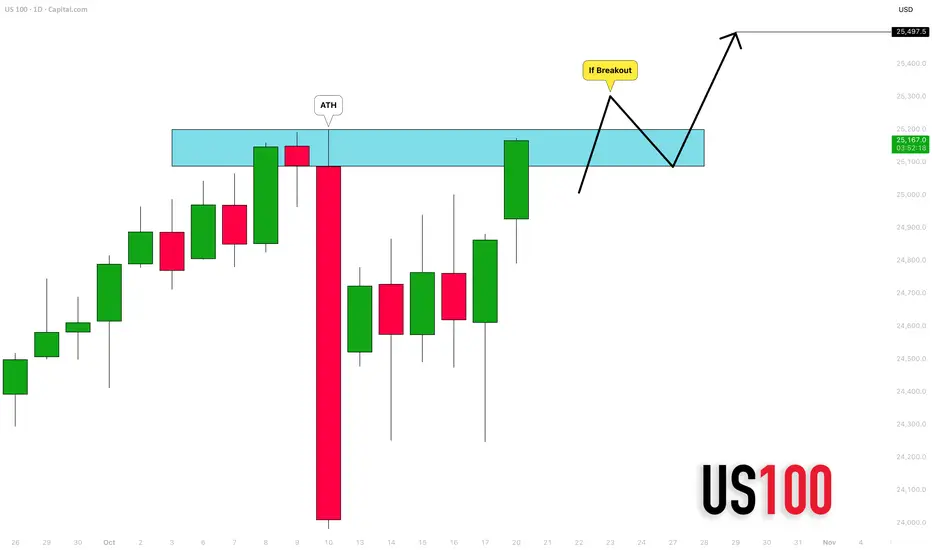
NASDAQ INDEX (US100): Get Ready for Breakout
Nasdaq index is currently testing a resistance based on a current
all-time high.
With a high probability, the market is going to break that.
A daily candle close above will confirm a violation.
A further growth will be expected at least to 25500 level then.
❤️Please, support my work with like, thank you!❤️
I am part of Trade Nation's Influencer program and receive a monthly fee for using their TradingView charts in my analysis.
$NDX Make or BreakNDX is consolidating in a triangle, and is now re-test 25200 strong level.
Inability to break above the triangle should see a break below the triangle and a move down to 24700 first.

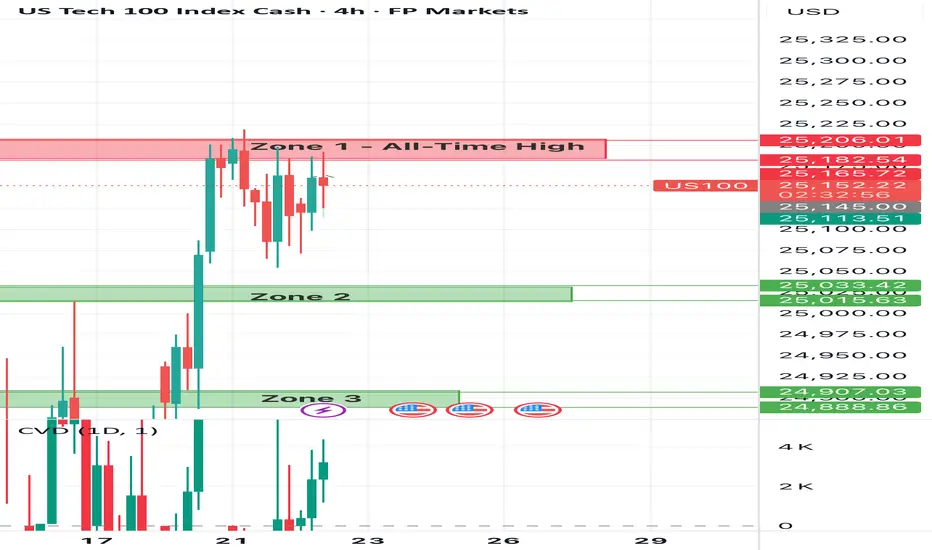
US100 on the Edge – Will Bulls Finally Break the All-Time HighZone 1: All-Time High / Major Supply Zone
This area represents the top of the market structure and the current all-time high region. Price has tested this level multiple times, forming a tight consolidation directly beneath it. This behavior indicates strong buying pressure but also clear absorption from sellers. Until the market shows a decisive breakout with volume confirmation, this zone acts as a heavy supply level. Traders should be cautious — breakouts near all-time highs often trigger fake moves before continuation.
Zone 2: Short-Term Demand / Breakout Retest Zone
Zone 2 marks the first layer of demand formed after the most recent breakout attempt. Buyers have consistently stepped in here to defend structure, suggesting it’s a valid short-term support area. If price remains above this level, the bullish structure remains intact. However, a clean break below Zone 2 would likely open the door for a retracement toward Zone 3.
Zone 3: Strong Demand / Breakout Base
This zone represents the base of the breakout — Monday’s low — where buyers aggressively entered and drove price upward through prior resistance. It’s a key liquidity pocket and the foundation of the current move. As long as the market holds above this zone, the bullish bias remains valid. A break below, however, would signal that momentum has faded and could trigger a deeper correction.
Sentiment
After a strong start to the week, the Nas100 is trading with a tone of cautious optimism. Monday’s momentum carried into Tuesday as easing US–China trade tensions and solid performances from major tech names helped maintain positive sentiment. However, with the index hovering near record highs, investors have turned more selective and defensive.
The broader market tone remains constructive — risk appetite is still present, but confidence is fragile. Many traders are waiting for fresh catalysts from corporate earnings and macro data to confirm whether the recent rally has more room to run. The ongoing US government shutdown continues to cloud visibility, delaying key data releases and adding an element of uncertainty.
Overall, sentiment around the Nas100 is positive but tentative: the market is stable and supported by tech strength and improved trade signals, yet stretched valuations and the lack of new macro clarity keep investors cautious at the top.
take asia? nihaumaybe we can take out asia high today and revers?? double top out of the playbook like so many gurus wil say
full margin full risk best of luck to everybody we'll see in a moment

US NAS 100Preferably suitable for scalping and accurate as long as you watch carefully the price action with the drawn areas.
With your likes and comments, you give me enough energy to provide the best analysis on an ongoing basis.
And if you needed any analysis that was not on the page, you can ask me with a comment or a personal message.
Enjoy Trading ;)

US100 shortlooks like that the market wants to "fight" against the liquidity that has been built yesterday... NY-opening I love u <3 xD
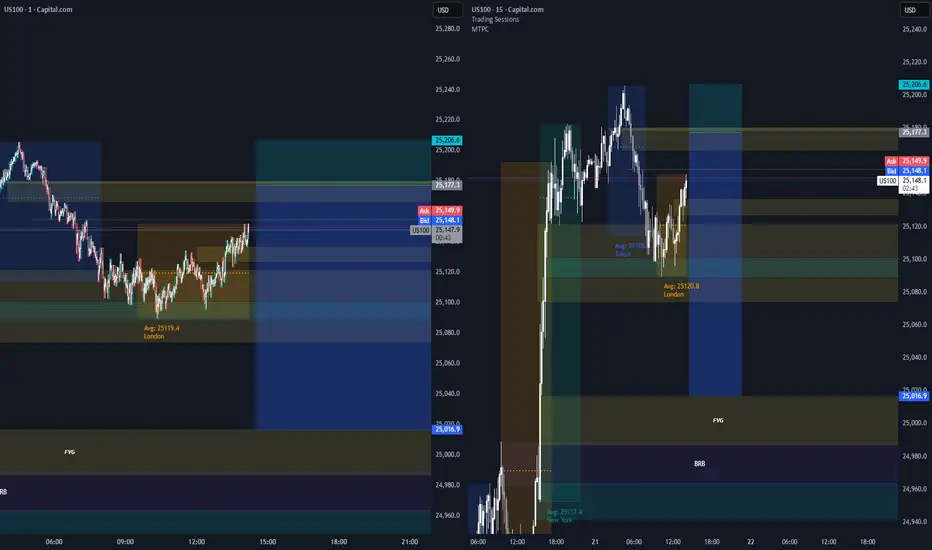
US100: Needs a healthy pullback before breaking highs🧭 SKILLING:US100 (30-Min Chart) – The Market Needs a Pause Before the Breakout
After a strong recovery from the 24,200 area , the US100 has shown an impressive upward acceleration, forming a steep speed line that pushed price back toward the previous highs around 25,150 – 25,250 — a major resistance zone where sellers previously dominated.
However, as price reaches this area, the bullish momentum is starting to fade. Smaller candles and indecisive movements reveal hesitation — buyers are still in control, but the strength that carried the market this far is beginning to weaken.
If we look closely at the market structure, it’s clear that the index has been trying to reclaim the entire prior range, but that effort hasn’t come easy. After such a fast rally, the market looks overextended, and bulls may need a healthy pullback to gather enough energy for a real breakout.
________________________________________
🔍 Technical Outlook
• The 25,150 – 25,250 zone remains the key resistance area. If price keeps getting rejected here, short-term sellers might step in.
• A corrective move toward 24,850 – 24,950 (the pink zone) would not be surprising.
• That area should be watched closely — if buyers defend it strongly, it could become the launchpad for another push toward new highs.
________________________________________
🎯 Personal View
The overall structure still favors the bullish side, but momentum needs a reset.
A short-term pullback shouldn’t be seen as weakness — it’s an opportunity for the market to rebalance before the next leg up.
If the 24,850 zone holds, the probability of a true breakout above 25,250 increases significantly, potentially opening room toward 25,400 – 25,500 in the next sessions.
________________________________________
💬 In summary:
The US100 has worked hard to reclaim lost ground, but breaking above the previous top will require fresh momentum. A short-term correction could be exactly what the market needs to build a stronger foundation for a sustainable rally.
Please like and comment below to support our traders. Your reactions will motivate us to do more analysis in the future 🙏✨
Harry Andrew @ ZuperView

Clown market deserves the best tricksCan Trump save the world again by the end of the day? In this market anything is possible. It looks like the weekly open will hold.
