BAFL – TECH BUY CALL by THE CHART ALCHEMIST 27 Sept 2025 (1H TF)BAFL – TECH BUY CALL by THE CHART ALCHEMIST- 27 Sept 2025 (1H TF)
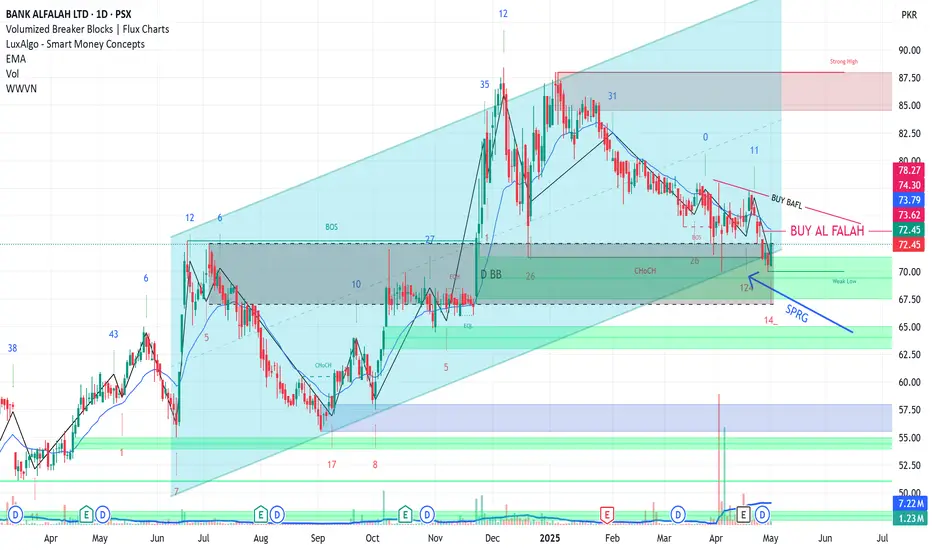
The stock broke out of a bearish pullback channel (marked in light blue) and formed two bullish structures, providing a safe entry point for new trades.
📢 Disclaimer: Technical analysis by Mushtaque Muhammad (The Chart Alchemist).
Trade ideas

BAFL is near to END of Major cycleBAFL is near to END of Major cycle
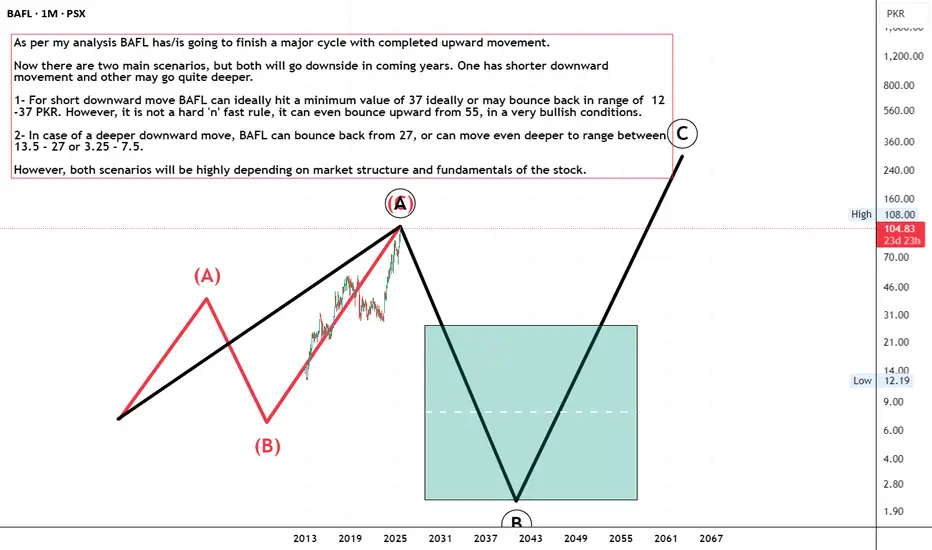
As per my analysis BAFL has/is going to finish a major cycle with completed upward movement.
Now there are two main scenarios, but both will go downside in coming years. One has shorter downward movement and other may go quite deeper.
1- For short downward move BAFL can ideally hit a minimum value of 37 ideally or may bounce back in range of 12 -37 PKR. However, it is not a hard 'n' fast rule, it can even bounce upward from 55, in a very bullish conditions.
2- In case of a deeper downward move, BAFL can bounce back from 27, or can move even deeper to range between 13.5 - 27 or 3.25 - 7.5.
However, both scenarios will be highly depending on market structure and fundamentals of the stock.
BAFL LONG TRADEBAFL has been in uptrend channel since long
It has touched its bottom and given positive rebound yesterday
It just needs one more green candle confirmation above 73
Buy BAFL if it crosses 73.5
TP 84
SL 68
BAFL Stock in Correction Phase After RallyThe monthly chart for Bank Alfalah Ltd (BAFL) on the Pakistan Stock Exchange shows a strong upward price movement followed by a corrective phase. After a significant rally, increasing by 37.17%, the price has pulled back and is currently testing support around the 61.99 PKR level. Key Fibonacci retracement levels indicate potential support at 55.50 PKR (38.2% retracement), with stronger support at 50.18 PKR and 44.85 PKR if the correction deepens. The price appears to be consolidating, and a bounce from these levels could target the previous high of 85.03 PKR. Volume trends during the rally suggest sustained interest, but the current phase reflects a cautious correction.


BAFL1. Flag pattern formation near the Upper blue dotted Trendline can be seen.
2. Any candle closing blue dotted or above flag pattern considered (Breakout)
3. Price Trading above the Horizontal Line is a safe Area for price to move up.
4. Any Closing candle below the orange Horizontal support line moves to the Bearish trend.

Bank Al Falah LimitedAfter the pull back from 0.382 Fib level, BAFL is currently trading above support level which shows upward momentum continues. Upward trajectory can move the share to its indicated resistance level of 43.50. If this level breaks then price can test 47.93 and 53.46. However, it can show a downward trajectory if it breaks support level of 37.48.

BAFL AnalysisWe can confirm our analysis on the basis of confluence in which candle closes above 21 EMA and volume seems to be huge. Considering this we can take a short profit, by buying this stock at closing price which is close to 41 and then apply a stop loss at 40.50 and can take profit around resistance zone which is 43 and it can be validated by Fibonacci retracement
