PTEN, 2/21-4/15, -2% LossOn 2/14/2024, Patterson-UTI Energy (PTEN) reported earnings of $0.19 per share on revenue of $1.584 billion for the fourth quarter ended December 2023. The consensus earnings estimate was $0.184 per share on revenue of $1.507 billion.
1.03USD
246.29 MUSD
4.15 BUSD
356.63 M
About Patterson-UTI Energy, Inc.
Sector
Industry
CEO
William Andrew Hendricks
Website
Headquarters
Houston
Employees (FY)
10.6 K
Founded
1978
ISIN
US7034811015
FIGI
BBG000BKXFN7
Patterson-UTI Energy, Inc. engages in the provision of drilling and pressure pumping services, directional drilling, rental equipment, and technology. It operates through the following segments: Drilling Services, Completion Services, and Drilling Products. The Drilling Services segment represents contract drilling, directional drilling, oilfield technology, and electrical controls and automation businesses. The Completion Services segment offers hydraulic fracturing, wireline and pumping, completion support, cementing, and pressure pumping business. The Drilling Products segment focuses on manufacturing and distribution of drill bits business. The company was founded by Cloyce A. Talbott and A. Glenn Patterson in 1978 and is headquartered in Houston, TX.

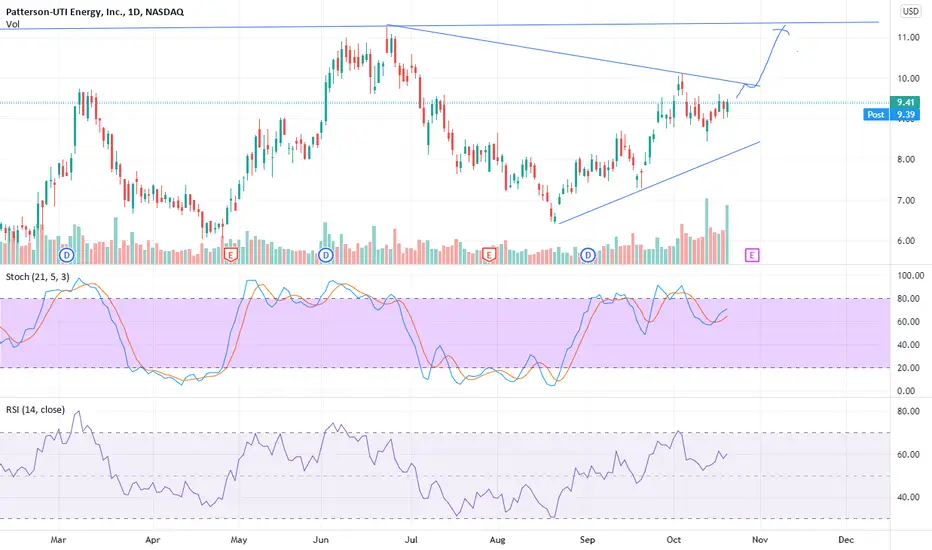
PTEN: Long position, bullish wedge with huge profit potential 🛢There is nice setup by bullish wedge for mid/long term breakout position trade on
PTEN.
After more than 1year consolidation formed bullish wedge. Now price starting to pump up out of the wedge. at 15.87 level there is 1st potential to take some money of the table because there is long multi years s

Patterson-UTI overflowing. PTENWe are not in the business of getting every prediction right, no one ever does and that is not the aim of the game. The Fibonacci targets are highlighted in purple with invalidation in red. Fibonacci goals, it is prudent to suggest, are nothing more than mere fractally evident and therefore statisti

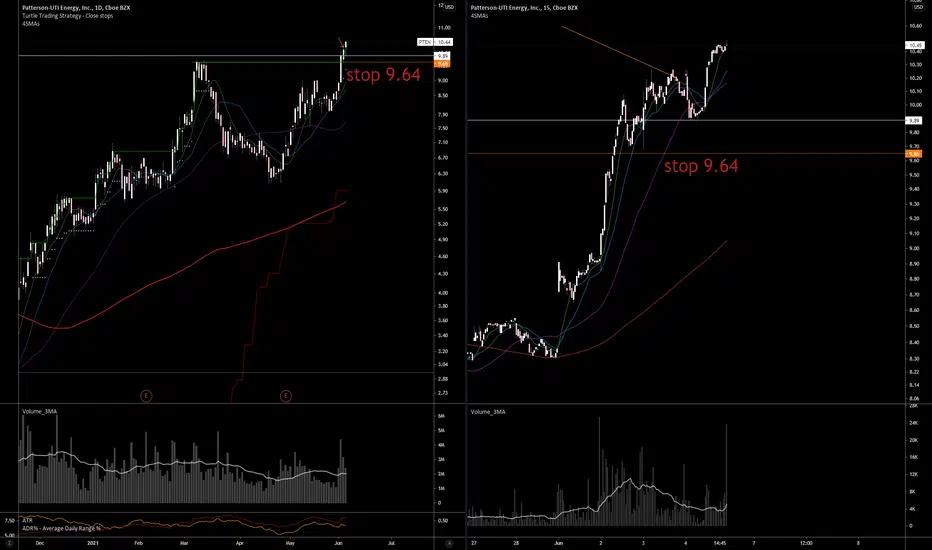
Long scalp PTENBased on its uptrend, rebound from support and a familiar chart pattern confirmed by my technical indicators, I expect at least half a percent in profits IF PTEN exceeds today's high of $16.31 during tomorrow's session.


US Stock In Play: $PTEN$PTEN is a onshore drilling contractor for o&g operators in US and CA.
RS as it traded to one month high, higher lows since dec'21 with rising in all MAs of various timeframe. cup and 2 years cup and handle pattern.
we have a good 2 weeks to Q4 earnings for some risk cushion.

PTEN - (US Equity) Bullish Reversal Pattern - BUYPTEN listed on US markets, formed an inverse head and shoulders pattern, poised for a faster recovery to $15 and then $25 in the coming months.
look to buy with stop loss kept below the $6.50 support level.


See all ideas
Trade directly on the supercharts through our supported, fully-verified and user-reviewed brokers.


Frequently Asked Questions
The current price of PTEN is 11.34 USD — it has increased by 1.07% in the past 24 hours.
Depending on the exchange, the stock ticker may vary. For instance, on NASDAQ exchange Patterson-UTI Energy, Inc. stocks are traded under the ticker PTEN.
Patterson-UTI Energy, Inc. is going to release the next earnings report on May 1, 2024. Keep track of upcoming events with our Earnings Calendar.
PTEN stock is 3.02% volatile and has beta coefficient of 0.61. Check out the list of the most volatile stocks — is Patterson-UTI Energy, Inc. there?
One year price forecast for Patterson-UTI Energy, Inc. has a max estimate of 19.00 USD and a min estimate of 14.00 USD.
PTEN earnings for the last quarter are 0.20 USD whereas the estimation was 0.25 USD which accounts for −18.68% surprise. Estimated earnings for the next quarter are 0.18 USD. See more details about Patterson-UTI Energy, Inc. earnings.
Patterson-UTI Energy, Inc. revenue for the last quarter amounts to 1.01 B USD despite the estimated figure of 1.04 B USD. In the next quarter revenue is expected to reach 1.51 B USD.
Yes, you can track Patterson-UTI Energy, Inc. financials in yearly and quarterly reports right on TradingView.
PTEN stock has fallen by 6.44% compared to the previous week, the month change is a 2.24% fall, over the last year Patterson-UTI Energy, Inc. has showed a 3.65% decrease.
PTEN net income for the last quarter is 61.95 M USD, while the quarter before that showed 50.00 K USD of net income which accounts for 123.80 K% change. Track more Patterson-UTI Energy, Inc. financial stats to get the full picture.
Today Patterson-UTI Energy, Inc. has the market capitalization of 4.58 B, it has increased by 1.68% over the last week.
Yes, PTEN dividends are paid quarterly. The last dividend per share was 0.08 USD. As of today, Dividend Yield (TTM)% is 2.85%. Tracking Patterson-UTI Energy, Inc. dividends might help you take more informed decisions.
Patterson-UTI Energy, Inc. dividend yield was 2.96% in 2023, and payout ratio reached 36.39%. The year before the numbers were 1.19% and 28.38% correspondingly. See high-dividend stocks and find more opportunities for your portfolio.
Like other stocks, PTEN shares are traded on stock exchanges, e.g. Nasdaq, Nyse, Euronext, and the easiest way to buy them is through an online stock broker. To do this, you need to open an account and follow a broker's procedures, then start trading. You can trade Patterson-UTI Energy, Inc. stock right from TradingView charts — choose your broker and connect to your account.
As of Apr 18, 2024, the company has 10.60 K employees. See our rating of the largest employees — is Patterson-UTI Energy, Inc. on this list?
Investing in stocks requires a comprehensive research: you should carefully study all the available data, e.g. company's financials, related news, and its technical analysis. So Patterson-UTI Energy, Inc. technincal analysis shows the sell today, and its 1 week rating is sell. Since market conditions are prone to changes, it's worth looking a bit further into the future — according to the 1 month rating Patterson-UTI Energy, Inc. stock shows the sell signal. See more of Patterson-UTI Energy, Inc. technicals for a more comprehensive analysis.
If you're still not sure, try looking for inspiration in our curated watchlists.
If you're still not sure, try looking for inspiration in our curated watchlists.
We've gathered analysts' opinions on Patterson-UTI Energy, Inc. future price: according to them, PTEN price has a max estimate of 19.00 USD and a min estimate of 14.00 USD. Read a more detailed Patterson-UTI Energy, Inc. forecast: see what analysts think of Patterson-UTI Energy, Inc. and suggest that you do with its stocks.
EBITDA measures a company's operating performance, its growth signifies an improvement in the efficiency of a company. Patterson-UTI Energy, Inc. EBITDA is 1.16 B USD, and current EBITDA margin is 28.08%. See more stats in Patterson-UTI Energy, Inc. financial statements.