PYTH/USDT — the Final Defense Before a Potential Breakout Move?PYTH is now trading at a critical turning point, hovering right above the major demand zone at 0.100–0.089 USDT (yellow block).
This area has acted as a strong defensive wall for buyers several times in the past.
However, persistent lower highs under the descending trendline are showing strong selli

pyth analysis 20 oct 2025if today 20 oct 2025 daily close we can stand the price above 0.118 , possibly we can continue rally up

YTHUSDT Analysis – The Biggest Market Crash Yet!👋 Welcome to TradeCityPro Channel!
🌐 Overview of Bitcoin
Before we begin, let me remind you that we’ve moved the Bitcoin analysis section to a separate daily report at your request, so we can go into more detail about Bitcoin’s condition, price action, and dominance:
🌙 Last night, the crypto m
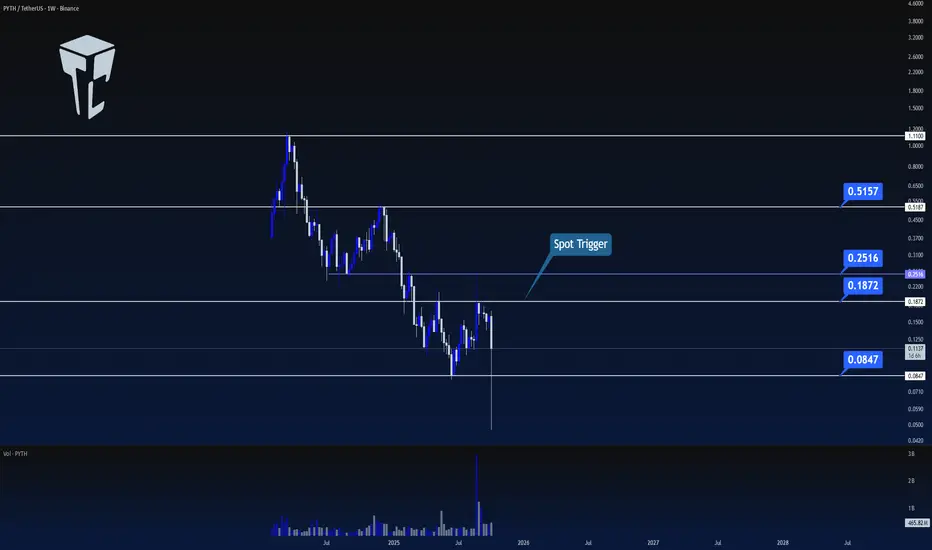
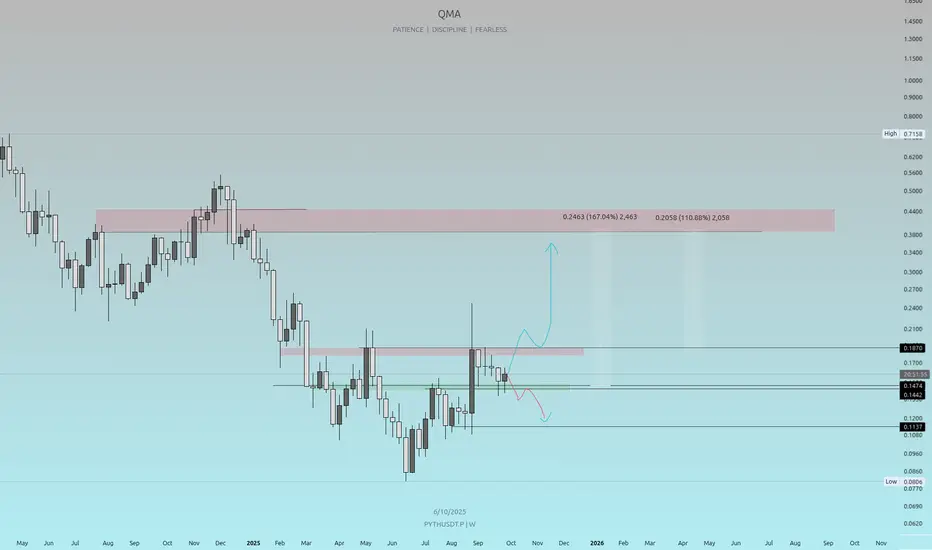
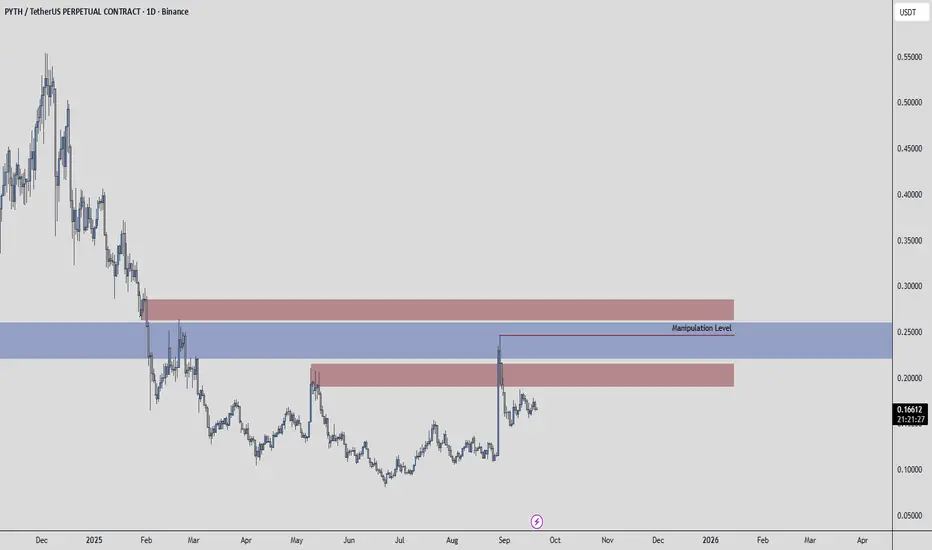
PYTHUSDT Weekly Analysis Is PYTH breaking out for a strong move up or gearing for a correction? This analysis identifies key levels to watch for high-probability entries and exits.
Price Levels to Watch:
Resistance Zone: $0.44–$0.50 (major supply area)
Intermediate Resistance: $0.1870
Current Price Support: $0.1445
Sup
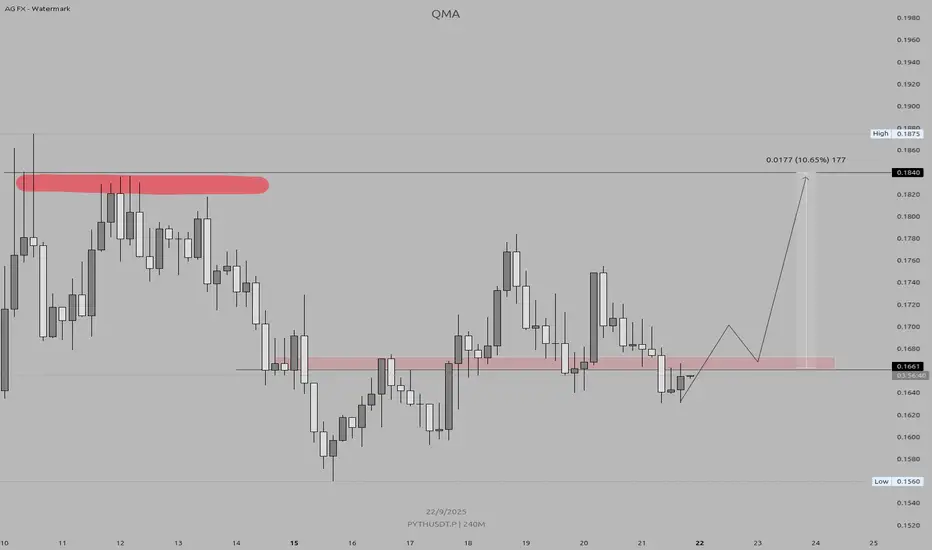
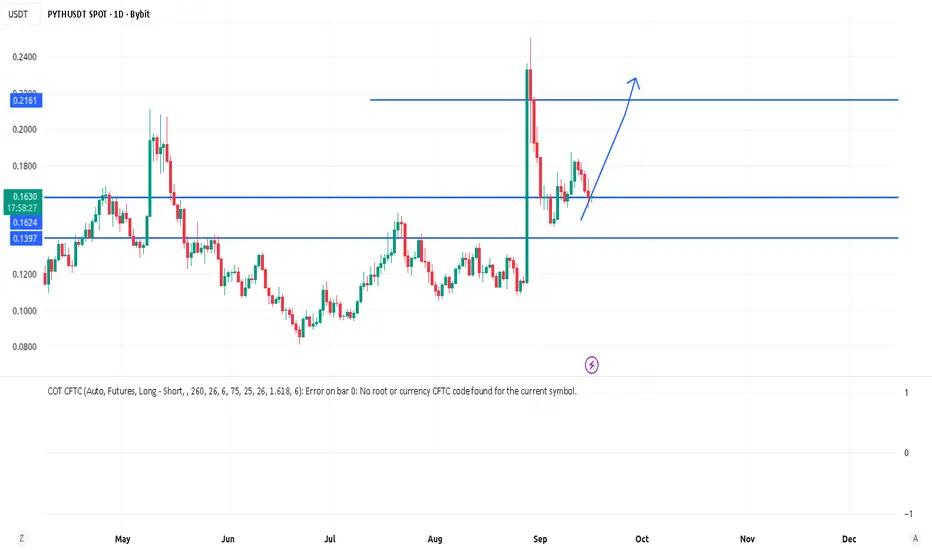
PYTH/USDT – Bullish Re-Test SetupKey Level: 0.167 (Previous Support → Now Resistance)
Target: 0.18 – 0.185
Timeframe: 4H (240M)
✅ Trade Conditions:
Price must reclaim and close above 0.167 on the 4-hour candle.
This confirms bullish strength and breaks the previous downtrend.
🎯 Action:
Enter on close above 0.167
Stop Loss:
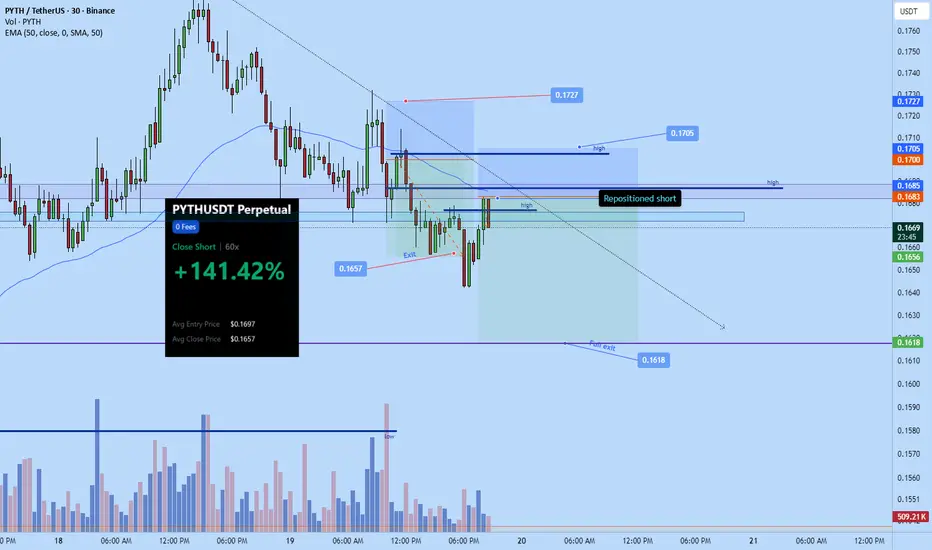
Pyth dump today--> $0.1618sl: 0.1705
Tp: 0.1618
Went short a while ago on pyth. Overall I think pyth will break back down to $0.15 area. Aiming tp tonight at $0.1618.
Entered a position earlier as well but forgot to p0st here
ATOMUSDT | Short From Red Box, Long-Term SetupResistance Zone;
ATOMUSDT is facing heavy resistance at the red box, making it an attractive short entry zone. Structure shows sellers remain active here, and momentum hasn’t shifted yet.
Risk Management;
For risk management, I’m anchoring this setup with a stop at 7.9. That level is key a
Crypto Charts & Levels (Live Breakdown)All Charts & Levels From Today’s Live Breakdown 🎯📈
Here’s the complete walkthrough from today’s live session — a jam-packed review of everything on the radar. From majors like ETH to niche plays like KEETA, we’re covering support, resistance, and directional bias one by one 👇
🔹 ETHEREUM (ETH)
Su

PYTH- BULLISH CHANNEL BREAKOUTEURONEXT:PYTH - bullish breakout ✅📈
Upper resistances:
🎯0.1780
🎯0.1830
🎯0.1865
A D1 candle close above 0.1800$ tonight, could lead to another explosif 40%+ move! 🚀
Medium term outlook playing well!

pyth can jump soon !BINANCE:PYTHUSDT showing strong support near 14 and expecting an upside movement soon.
Note: I'm not a good analyst. Just sharing my thoughts. Also ignore my horrible drawing .
Thanks
See all ideas
Summarizing what the indicators are suggesting.
Oscillators
Neutral
SellBuy
Strong sellStrong buy
Strong sellSellNeutralBuyStrong buy
Oscillators
Neutral
SellBuy
Strong sellStrong buy
Strong sellSellNeutralBuyStrong buy
Summary
Neutral
SellBuy
Strong sellStrong buy
Strong sellSellNeutralBuyStrong buy
Summary
Neutral
SellBuy
Strong sellStrong buy
Strong sellSellNeutralBuyStrong buy
Summary
Neutral
SellBuy
Strong sellStrong buy
Strong sellSellNeutralBuyStrong buy
Moving Averages
Neutral
SellBuy
Strong sellStrong buy
Strong sellSellNeutralBuyStrong buy
Moving Averages
Neutral
SellBuy
Strong sellStrong buy
Strong sellSellNeutralBuyStrong buy
Displays a symbol's price movements over previous years to identify recurring trends.