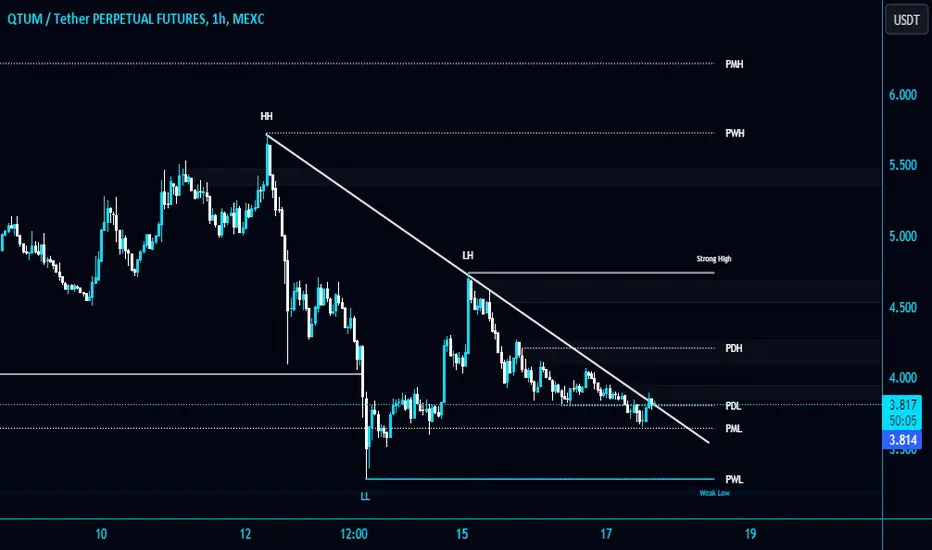
#QTUM/USDT is trying to break the Diagonal Trendline in 1-hour T#QTUM/USDT is trying to break the Diagonal Trendline in 1-hour TF!
So far, no luck. AMEX:QTUM needs to clear the Trendline to gain bullish momentum. Wait for BO & retest to open a long position.
#QTUM is holding PML $3.65 as a strong support. The next support level is PWL $3.29.
QTUMUSDT UPDATEAMEX:QTUM
UPDATE
AMEX:QTUM is at a strong support level and getting a good volume. We can see gain here upto 60%+ soon
#QTUM #QTUMBNB #QTUMBTC #QTUMUSDT #QTUMSOL #Sol #CRYPTO

QTUM LONG SETUP ALL trading ideas have entry point + stop loss + take profit + Risk level.
hello Traders, here is the full analysis for this pair, let me know in the comment section below if you have any questions, the entry will be taken only if all rules of the strategies will be satisfied. I suggest you keep thi

QTUM is moving along the bullish channelQTUM is moving along the bullish channel
🔵Entry Zone 4.964 - 5.154
🔴SL 4.503
🟢TP1 5.468
🟢TP2 5.910
🟢TP3 6.374
Risk Warning
Trading Forex, CFDs, Crypto, Futures, and Stocks involve a risk of loss. Please consider carefully if such trading is appropriate for you. Past performance is not indicative

QTUM looks a rocket !QTUM seems to have entered a bullish diametric for some time now.
Now it seems to be inside wave D of this diametric.
The green range is a suitable place for buy/long positions.
The targets are marked on the chart.
Closing a daily candle below the invalidation level will violate the analysis
For ri

QTUM SET FOR BULLISH RALLYQTUM is currently trading in downtrend due to rise in BTC Dominance and is currently going towards demand zone. Breakout from a descending channel can be signal towards bullish rally and resistance zone.

QTUM/USDT A Bullish Journey from a Pivotal Demand Level👀🚀💎 Paradisers, buckle up for an enthralling ride with #QTUMUSDT as it plans a bullish journey from a critical demand level at $3.756. This level hints at a robust leap into bullish territory.
💎 A standout feature is its escape from a descending trendline, propelling #QTUM on an optimistic trajectory

QTUM - Very clear!Dear my friends,
QTUM has broken the downtrend and is recharging. Price is above the support zone. A cumulative set of candles with a series of wicks. The possibility of an explosion in the last days of the year is very strong. Looking at the monthly frame, this is even more evident when observing R

QTUM macroeven thought alt coins have pumped a lot, the rally is not over, some alt coins haven't even started
I believe most alt coins will do at least a 10x from their CMP (march 2024)
this is QTUM and the chart looks bullish to me
but you should never follow blindly,
have your own analysis too
educatio

Altcoin Boom and QTUMUSDT 150% PotentialQTUMUSDT has broken above the uptrend trendline resistance, a significant milestone in its price action journey. Following this breakout, we observed a subsequent breach of the previously established high at $4.27. While the current pullback may appear as a temporary setback, it actually presents a

See all ideas
Frequently Asked Questions
Qtum / TetherUS (QTUM) reached the lowest price of 0.710 USDT on Mar 13, 2020.
See the list of crypto losers to find unexpected opportunities.
See the list of crypto losers to find unexpected opportunities.
Crypto markets are famous for their volatility, so one should study all the available stats before adding crypto assets to their portfolio. Very often it's technical analysis that comes in handy. We prepared technical ratings for Qtum / TetherUS (QTUM): today its technical analysis shows the sell signal, and according to the 1 week rating QTUM shows the buy signal. And you'd better dig deeper and study 1 month rating too — it's neutral. Find inspiration in Qtum / TetherUS trading ideas and keep track of what's moving crypto markets with our crypto news feed.
Qtum / TetherUS price has risen by 4.66% over the last week, its month performance shows a 13.53% decrease, and as for the last year, Qtum / TetherUS has increased by 34.06%.
Keep track of coins' changes with our Crypto heatmap.
Keep track of coins' changes with our Crypto heatmap.
Qtum / TetherUS (QTUM) reached its highest price on May 7, 2021 — it amounted to 35.685 USDT.
See the list of crypto gainers and choose what best fits your strategy.
See the list of crypto gainers and choose what best fits your strategy.
Qtum / TetherUS (QTUM) is just as reliable as any other crypto asset — this corner of the world market is highly volatile. Today, for instance, Qtum / TetherUS is estimated as 4.24% volatile. The only thing it means is that you must prepare and examine all available information before making a decision. And if you're not sure about Qtum / TetherUS, you can find more inspiration in our curated watchlists.
You can discuss Qtum / TetherUS (QTUM) with other users in our public chats, Minds or in the comments to Ideas.
Qtum / TetherUS highest price ever is 35.685 USDT, and the maximum drawdown from this value it has ever experienced is 4.93 K%, when Qtum / TetherUS reached 0.710 USDT.
The safest choice when buying QTUM is to go to a well-known crypto exchange. Some of the popular names are Binance, Coinbase, Kraken. But you'll have to find a reliable broker and create an account first. You can trade QTUM right from TradingView charts — just choose a broker and connect to your account.