fertilizer boomingalot of demand so I excpect much growth
always do your own research
I am not a financial advisor
1.105EUR
210.20 MEUR
3.87 BEUR
171.70 M
About K+S AG NA O.N.
Sector
CEO
Burkhard Lohr
Headquarters
Kassel
Website
Employees (FY)
11.45 K
Founded
1889
ISIN
DE000KSAG888
FIGI
BBG000BC8NR2
K+S AG is a holding company, which engages in the business of mining and processing of mineral raw materials. It offers mineral products for markets including agriculture, industry, consumers, communities, waste management, and transportation and logistics. The company was founded in 1889 and is headquartered in Kassel, Germany.

K+S could be prepare an outbreakA risky setup but good news on K+S may push this stock in a upward move: www.finanzen.net
Kepler sets target to 22 Euro. So a lot of movement is still possible

K+S / Can Potash be in new boom cycle10 years ago, there was a boom in potash: www.nasdaq.com
With rising prices in crops, it may happen again?!
If we have a super cycle: www.mining.com
Potash sanctions on belarus, may effect the price positivly: www.reuters.com
This espacially may effect K+S as alternativ company in the EU.
So th

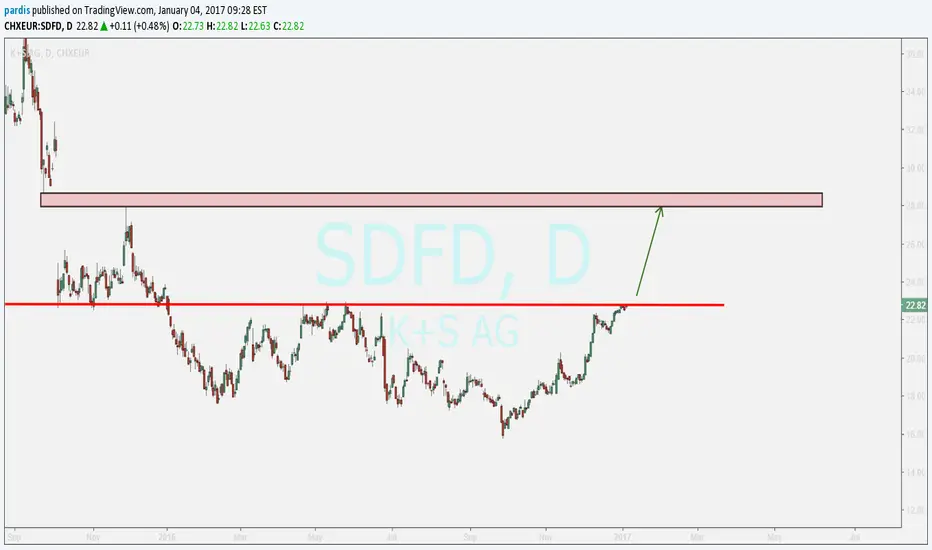
K+S small position for a larger possible outbreakWill Kali + Salz break out with new raw material boom again, as 15 years ago?
I will enter a small defensive position.


buyuptrend...
my suggestion is entry to buy position near end of market and with nice bullish candle


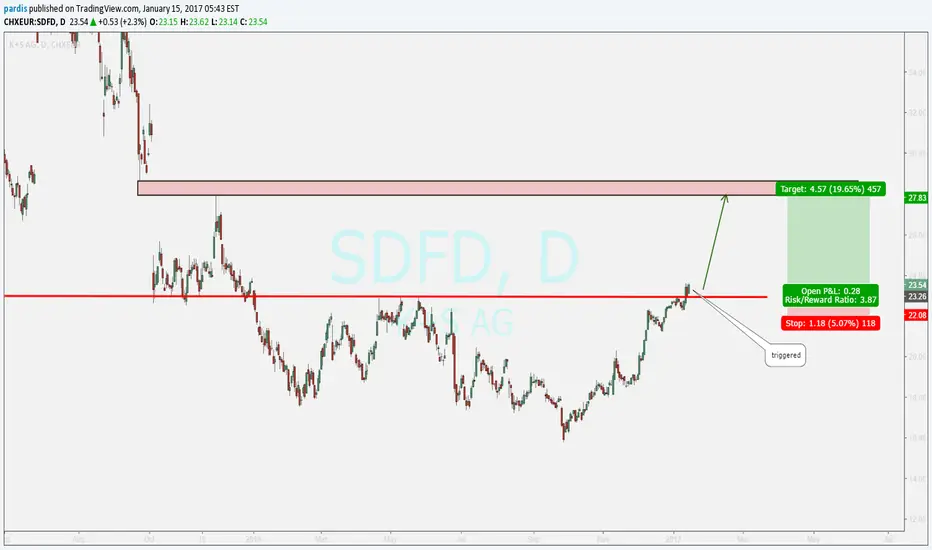
K+S reverted head and shoulders validatedK+S has validated its reverted head and shoulders, a strong uptrend has been initiated. Target is 23,5€.

See all ideas
Trade directly on the supercharts through our supported, fully-verified and user-reviewed brokers.


Frequently Asked Questions
The current price of SDF is 13.985 EUR — it has increased by 1.12% in the past 24 hours.
Depending on the exchange, the stock ticker may vary. For instance, on XETR exchange K+S AG NA O.N. stocks are traded under the ticker SDF.
K+S AG NA O.N. is going to release the next earnings report on May 13, 2024. Keep track of upcoming events with our Earnings Calendar.
SDF stock is 2.40% volatile and has beta coefficient of 0.28. Check out the list of the most volatile stocks — is K+S AG NA O.N. there?
One year price forecast for K+S AG NA O.N. has a max estimate of 20.000 EUR and a min estimate of 10.000 EUR.
SDF earnings for the last quarter are −0.19 EUR per share, whereas the estimation was −0.10 EUR resulting in a −86.67% surprise. The estimated earnings for the next quarter are 0.13 EUR per share. See more details about K+S AG NA O.N. earnings.
K+S AG NA O.N. revenue for the last quarter amounts to 880.80 M EUR despite the estimated figure of 849.61 M EUR. In the next quarter revenue is expected to reach 975.63 M EUR.
Yes, you can track K+S AG NA O.N. financials in yearly and quarterly reports right on TradingView.
SDF stock has risen by 0.97% compared to the previous week, the month change is a 5.03% rise, over the last year K+S AG NA O.N. has showed a 26.39% decrease.
SDF net income for the last quarter is 39.70 M EUR, while the quarter before that showed −47.60 M EUR of net income which accounts for 183.40% change. Track more K+S AG NA O.N. financial stats to get the full picture.
Today K+S AG NA O.N. has the market capitalization of 2.48 B, it has decreased by 0.21% over the last week.
Yes, SDF dividends are paid annually. The last dividend per share was 1.00 EUR. As of today, Dividend Yield (TTM)% is 7.23%. Tracking K+S AG NA O.N. dividends might help you take more informed decisions.
K+S AG NA O.N. dividend yield was 4.89% in 2023, and payout ratio reached 62.37%. The year before the numbers were 5.44% and 12.69% correspondingly. See high-dividend stocks and find more opportunities for your portfolio.
Like other stocks, SDF shares are traded on stock exchanges, e.g. Nasdaq, Nyse, Euronext, and the easiest way to buy them is through an online stock broker. To do this, you need to open an account and follow a broker's procedures, then start trading. You can trade K+S AG NA O.N. stock right from TradingView charts — choose your broker and connect to your account.
As of Apr 20, 2024, the company has 11.45 K employees. See our rating of the largest employees — is K+S AG NA O.N. on this list?
Investing in stocks requires a comprehensive research: you should carefully study all the available data, e.g. company's financials, related news, and its technical analysis. So K+S AG NA O.N. technincal analysis shows the neutral today, and its 1 week rating is sell. Since market conditions are prone to changes, it's worth looking a bit further into the future — according to the 1 month rating K+S AG NA O.N. stock shows the sell signal. See more of K+S AG NA O.N. technicals for a more comprehensive analysis.
If you're still not sure, try looking for inspiration in our curated watchlists.
If you're still not sure, try looking for inspiration in our curated watchlists.
We've gathered analysts' opinions on K+S AG NA O.N. future price: according to them, SDF price has a max estimate of 20.00 EUR and a min estimate of 10.00 EUR. Read a more detailed K+S AG NA O.N. forecast: see what analysts think of K+S AG NA O.N. and suggest that you do with its stocks.
EBITDA measures a company's operating performance, its growth signifies an improvement in the efficiency of a company. K+S AG NA O.N. EBITDA is 824.10 M EUR, and current EBITDA margin is 18.74%. See more stats in K+S AG NA O.N. financial statements.