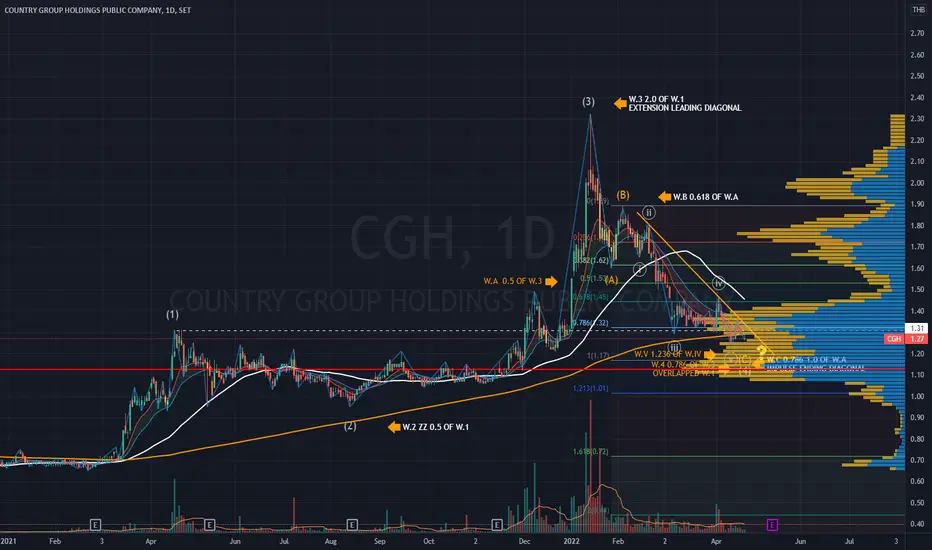
CGH | Elliott Wave Projection - Correction ABC Ending?Price action and chart pattern trading
> Elliott Wave projection - uptrend wave 1 - 3 Expanded Leading Diagonal type - wave 4 would overlap wave 1 position.
> Wave 3 extension - LEADING DIAGONAL - 2.0 of wave 1
> corrective ABC - wave A - impulse leading diagonal retraced 0.5 of wave 3
> wave B - zi
−0.05THB
−193.09 MTHB
1.29 BTHB
3.92 B
About COUNTRY GROUP HOLDINGS PCL NON-VOTING
Sector
Industry
CEO
Tommy Tachaubol
Website
Headquarters
Bangkok
Founded
2014
ISIN
TH5982010R12
FIGI
BBG007TJYN76
Country Group Holdings PCL is an investment company, which engages in the acquisition of controlling stakes in established businesses. It operates through the following business segments: Securities and Derivatives Brokerage, Securities Trading, Investment Banking, and Others. The Securities and Derivatives Brokerage segment provides brokering services for both local and foreign investors. The Securities Trading segment refers to the securities and derivatives trading segment, debt instrument investing segment, equity derivatives segment, and wealth plus segment. The Investment Banking segment includes financial advisory services and underwriting services. The Others segment relates to other investment related services. The company was founded on May 15, 2014 and is headquartered in Bangkok, Thailand.
CGH | Elliott Wave Projection - WAVE 4 and 5Price action and chart pattern trading setup
> Elliott Wave projection - 3rd Wave Extension at 1.618 Fibonacci extensions of Wave 1.
> Wave 4 ABC zigzag correction - current Wave C position estimated exactly at 1.0 of Wave A slightly overlapped Wave 1.
> Assuming that Wave 4 is here, estimated Wave


See all ideas
Trade directly on the supercharts through our supported, fully-verified and user-reviewed brokers.

