XAGUSDHello Traders! 👋
What are your thoughts on Silver ?
Silver entered a corrective phase following its recent rally and is now trading below the resistance zone and the broken trendline.
This structure suggests weakening bullish momentum and a potential continuation to the downside once the pullback completes.
We expect price to complete a pullback toward the broken zone and then resume its downward movement toward the identified support levels.
As long as silver remains below the resistance and trendline, the bearish bias stays valid.
A confirmed break and close above resistance would invalidate this scenario.
Don’t forget to like and share your thoughts in the comments! ❤️
Trade ideas

SILVER Down Trend breakout bullish from support zoneSilver Bullish Breakout Alert! 💥
📉 After a strong downtrend, Silver has shown a bullish move from the key support zone at $48.200 🪙
📊 Timeframe: 1H
🎯 Technical Targets:
1️⃣ $49.400
2️⃣ $50.600
3️⃣ $52.500
⚙️ Setup:
✅ Buying from support
✅ Breakout confirmation
✅ Trend reversal signs visible
💡 Tip: Always use proper risk management and stick to your trading plan! 🧠💰
📈 Stay patient, stay disciplined, and let the chart do the talking.
🔥 Like | 💬 Comment | 📤 Share if you found this helpful!
#Silver #XAGUSD #BreakoutTrading #BullishMove #PriceAction #TechnicalAnalysis #TradingSetup
#XAGUSD(SILVER): Bears In Control Three Targets Swing SellSilver’s price dropped significantly yesterday, continuing a trend from last week’s Thursday when substantial trading commenced.
The data suggests an increase in bearish volume, indicating a potential selling opportunity. To identify a more precise entry zone, we should utilise smaller timeframes.
Once this is established, we can create a trading plan with strict risk management. Upon entry, we can select a suitable take-profit area based on our individual trading style and risk management preferences.
For further information, please like and comment on the ideas. Any questions comment down and we will happy to help.
Team Setupsfx

The Silver Storm: 9k Pips Down, but Bulls Start Breathing AgainWhile Gold has been volatile, Silver’s drop has been even more spectacular — a breathtaking 9,000-pip decline in just 10 days, from the all-time high near 54.50 down to 45.50, a correction of roughly 20%.
But let’s not forget — the prior rally was just as extreme: from 37 to almost 55, a 50% surge.
This kind of price behavior is typical for Silver — sharp on both sides. Yet, compared to Gold, the recent structure shows a few key differences worth noting:
________________________________________
🔍 Key Observations
1. Back Above the Ascending Trendline
After the recent low two days ago, Silver managed to climb back above the ascending trendline that started in late August — a strong early sign of stabilization.
2. Perfect 50% Retracement Support
The correction stopped exactly at the 50% Fibonacci retracement, perfectly aligned with a major horizontal support zone — a classic technical confluence.
3. Higher Low Confirmed
Unlike Gold, Silver printed a clear higher low last night, strengthening the case for a bullish recovery setup.
________________________________________
🎯 Outlook
Putting it all together, Silver appears to have completed its correction and looks technically stronger than Gold at this stage.
If the current momentum continues, a new test above 50 seems increasingly likely in the coming sessions.
🚀

31.10.25 Morning ForecastPairs on Watch -
FX:EURAUD
OANDA:XAGUSD
A short overview of the instruments I am looking at for today, multi-timeframe analysis down to what I will be looking at for an entry. Enjoy!

27.10.25 Morning ForecastPairs on Watch -
OANDA:XAGUSD
FX:EURCAD
FX:AUDUSD
A short overview of the instruments I am looking at for today, multi-timeframe analysis down to what I will be looking at for an entry. Enjoy!

Silver’s Bull Run Isn’t Over Yet – Here’s Why!Hey traders, today is a great time to revisit the Silver vs. Gold debate .
Fundamentally, Silver ( OANDA:XAGUSD ) is currently hitting some pretty impressive levels. In fact, we’ve just seen Silver break above its All-Time High(ATH), surpassing $50, driven by strong industrial demand and global economic uncertainties .
What does this mean for us? Well, while Gold ( OANDA:XAUUSD ) remains the classic safe haven, silver’s dual role—both as a precious metal and a key industrial commodity—gives it a unique edge right now. The recent breakout suggests that silver might actually be an even more compelling bullish play than gold in the current market environment.
So if you’re feeling bullish, there’s a solid fundamental case for silver shining a bit brighter these days. Let's keep an eye on how it moves.
---------------------------------------------------------
Let’s dive into the 4-hour timeframe for silver . Recently, with the help of a head and shoulders pattern , silver began a correction and reached its target .
At the moment, it looks like Silver has completed its pullback to a heavy resistance zone($49.82-$43.00) and is now moving near a Potential Reversal Zone(PRZ) and a Support line .
From an Elliott Wave perspective , it seems that silver has completed its main wave 3(New ATH=$49.82) and is currently working through its main wave 4 , which so far looks like a Zigzag Correction .
I expect that Silver will resume its upward movement and climb at least up to about $50.77(First Target) .
Second Target: $52.61
Stop Loss(SL): $45.82(Worst)
Please respect each other's ideas and express them politely if you agree or disagree.
Silver/ U.S. Dollar Analyze (XAGUSD), 4-hour time frame.
Be sure to follow the updated ideas.
Do not forget to put a Stop loss for your positions (For every position you want to open).
Please follow your strategy and updates; this is just my Idea, and I will gladly see your ideas in this post.
Please do not forget the ✅' like '✅ button 🙏😊 & Share it with your friends; thanks, and Trade safe.

Silver bull will try to throw you off, but long term healthyA pause that could refresh might be warranted in silver and gold.
I am still optimistic for precious metals long term.
Silver is still undervalued based on historical metrics and money supply.
I worry about the rise in metals and what it implies for the broad stock market indices.

XAGUSDXAGUSD price is in a correction phase, there is a possibility that the price will test the support level of 44$. If the price can hold above the level of 43.90, it is expected that the price will have a chance to rebound.
** Very Risky Trade
🔥Trading futures, forex, CFDs and stocks carries a risk of loss.
Please consider carefully whether such trading is suitable for you.
>>GooD Luck 😊
❤️ Like and subscribe to never miss a new idea!

Support has broken...and we have a 5 wave moved down...Folks, I was hoping we would see a 3-3-5 retrace which would complete around the $45-46 range, however, we have not confirmed a 5 wave move down which meand the pattern will actually be a 5-3-5 and we will go lower than originall expected...if heavily long you will be given a chance to lighten up on the next bounce (ABC pattern back up)...and you will be given a chance to buy lower...as marked on the chart...these are my expectations and is not investment advice.

XAGUSD – Liquidity Grab & Supply Rejection ScenarioThis chart illustrates a Smart Money Concept (SMC) outlook on Silver (XAGUSD) with key structural points:
Market Structure Breaks (MSB / BOS / CHOCH) highlighting shifts between bullish and bearish order flow.
Liquidity zones marked where prior highs/lows may attract orders.
Supply Zone (Be_BB) and Order Block (Be_OB) identified as potential reaction areas where price could face resistance.
Demand Zone Area (45.00–46.00) indicating a region of potential buying interest.
The projection visualizes a possible liquidity sweep above 48.45–49.64, followed by a bearish continuation into the demand zone.
All annotations are for educational and analytical purposes only, not financial advice.
Use this chart to study market structure, liquidity behavior, and institutional order flow concepts.

SILVER LONG FROM SUPPORT
SILVER SIGNAL
Trade Direction: long
Entry Level: 4,629.4
Target Level: 4,962.5
Stop Loss: 4,404.9
RISK PROFILE
Risk level: medium
Suggested risk: 1%
Timeframe: 3h
Disclosure: I am part of Trade Nation's Influencer program and receive a monthly fee for using their TradingView charts in my analysis.
✅LIKE AND COMMENT MY IDEAS✅

Silver price predictionSilver price prediction dor month of october based on my analysis and i am a beginner and just trying to predict based on the trend graph

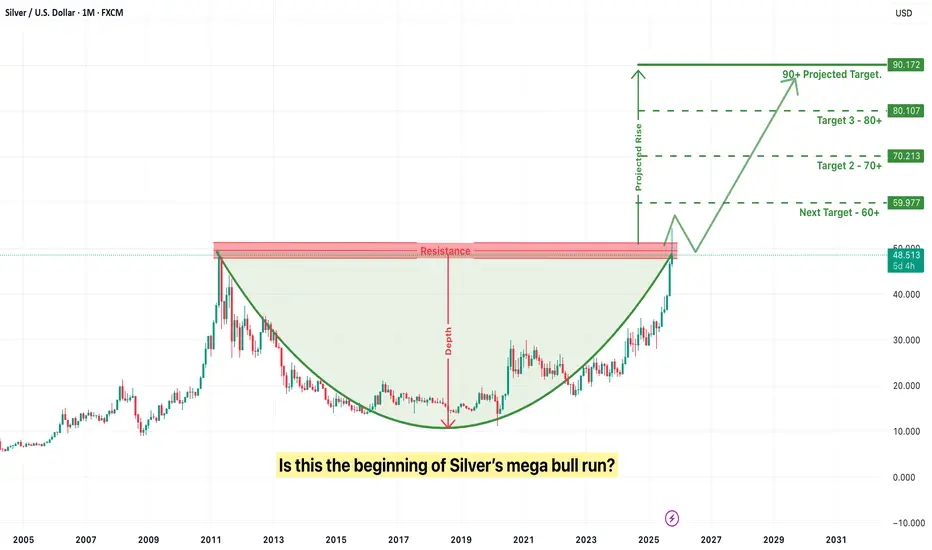
Is this the beginning of Silver’s mega bull run?For years silver has been seen as gold’s lesser companion — always important, but never truly leading. However, the world is now entering a new economic and technological era where silver is quietly transitioning from a secondary asset into a strategic metal of the future. What makes silver unique is that it is both an industrial metal and a monetary asset at the same time. Gold is used primarily for wealth protection, but silver has dual demand — it rises when technology adoption accelerates and it rises again when currencies weaken and investors seek a safe store of value. This rare combination places silver in a category of its own.
The most powerful driver behind silver’s future potential is the global energy and technology transformation. The world is rapidly shifting toward electric mobility, renewable power, high-speed communication networks and AI-scale computing. Every one of these megatrends directly increases silver consumption. Electric vehicles require significantly more silver than traditional cars because of their circuitry and conductivity needs. Solar panels have already become the single-largest industrial consumer of silver worldwide, and demand is projected to rise sharply due to green energy mandates and government policies. In the coming decade, silver will also be crucial to 5G infrastructure, robotics, space technology and medical-grade electronics. Simply put, modern technology cannot scale without silver.
While demand is rising rapidly, supply is structurally constrained. Most silver does not come from dedicated silver mines but as a by-product of mining other metals such as zinc, lead and copper. This means supply cannot simply increase when silver prices rise. If industrial base-metals mining slows, silver production automatically contracts. At the same time investment demand is rising, which creates a long-term deficit. This mismatch between rising demand and limited supply is exactly what leads to a major asset re-rating over time.
Another major factor supporting silver is the global macroeconomic cycle. Currencies across the world are losing value due to continuous money printing, rising debt and inflationary pressure. Investors are increasingly looking for hard assets that preserve purchasing power. Gold is traditionally the first choice, but it is already well accumulated and priced. Silver, being more affordable and under-owned, becomes the “accessible hedge” for the masses. Each time inflationary fears rise or fiat confidence falls, silver sees renewed investment flow.
Technically as well, silver is at a critical long-term juncture. The price structure is completing a multi-decade cup-and-handle pattern, which is one of the strongest bullish technical formations in commodity markets. Such large time-frame technical setups rarely appear, and when they do, their breakouts typically fuel multi-year trends rather than short rallies. A sustained breakout in silver has the potential to trigger a supercycle where price appreciation becomes exponential rather than linear.
However, while the long-term potential is extremely strong, investors should be aware of certain risks. Silver is far more volatile than gold and is known for sharp price swings in short timeframes. Breakouts can also produce temporary fake moves, trapping impatient investors who enter at the top and exit at the first correction. Because silver is tied to industrial demand, a short-term slowdown in the global economy can temporarily affect prices even when the long-term thesis remains intact. Another caution is the difference between physical silver and paper silver. Physical markets reflect real-world scarcity, while paper silver markets (ETFs, futures) can sometimes be suppressed by large institutional trading, creating short-term price distortions that do not reflect underlying fundamentals.
The key to winning with silver is adopting a patient, long-term perspective instead of a speculative trading mindset. Accumulation through systematic or staggered buying reduces timing risk and prevents emotional decision-making. A blend of physical holding for long-term security and digital exposure for liquidity creates the most efficient structure. Silver has historically rewarded patience and conviction while punishing emotional exits.
In conclusion, silver stands at the intersection of three powerful global shifts — technological transformation, monetary instability and resource scarcity. It is no longer just a precious metal; it is becoming a strategic asset for the coming decade. Gold protects capital, but silver has the potential to multiply it. This is why many economists, historians and market analysts believe silver is poised to become one of the most powerful wealth-building assets of the future.
Silver - The catastrophic rejection!🆘Silver ( TVC:SILVER ) is just collapsing:
🔎Analysis summary:
At this exact moment, Silver is retesting the previous all time highs, which were already rejected about 45 years ago. Considering the extremely bearish rejection on the smaller timeframes, Silver simply fails to break out. This will lead to a devastating reversal.
📝Levels to watch:
$50
SwingTraderPhil
SwingTrading.Simplified. | Investing.Simplified. | #LONGTERMVISION

XAGUSD | SILVER LONG SETUPWent long on silver because it looked shinier than my future. 📈✨
aka the ‘Hope, Cope, Nope’ zones.
If this hits TP, I’m buying a spoon made of it. If it hits SL, I’ll be eating soup with my hands.

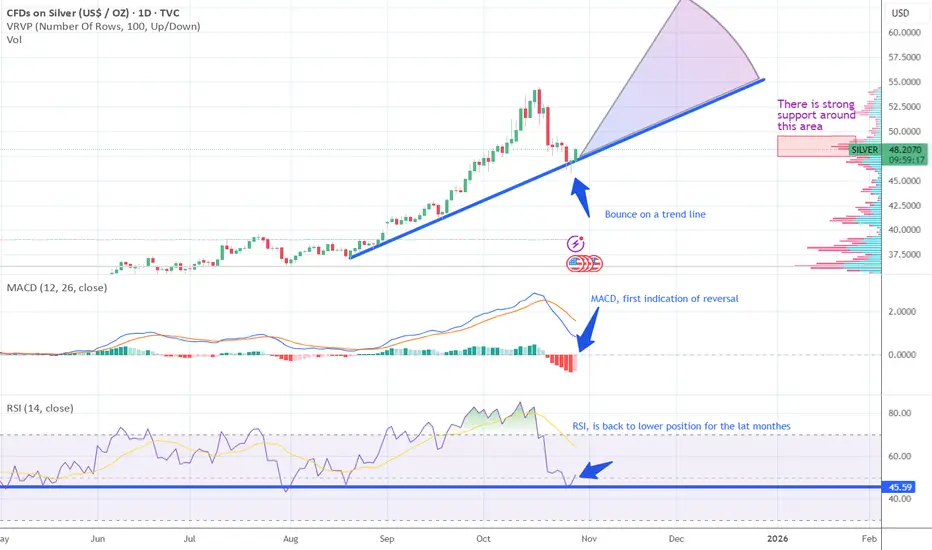
Trading Idea for SilverSilver seems to have found a retracement bottom in an long uptrend move. At this point it looks promising for adding to a silver position for the long term.
Argument points that point to a uptrend from here are:
MACD
RSI
Trend candles
SILVER (XAG/USD): Potential Pullback Trade ExplainedThe price of ⚠️SILVER is currently consolidating within a strong horizontal support structure.
To initiate a long position with a confirmation, wait for a bullish breakout of the resistance of the range on a 4H time frame.
A 4H candle closing above 49.40 will confirm a violation.
A Subsequent bullish momentum is anticipated, potentially reaching the 50.50 resistance level.
The setup will be invalidated if the price establishes a new lower low.

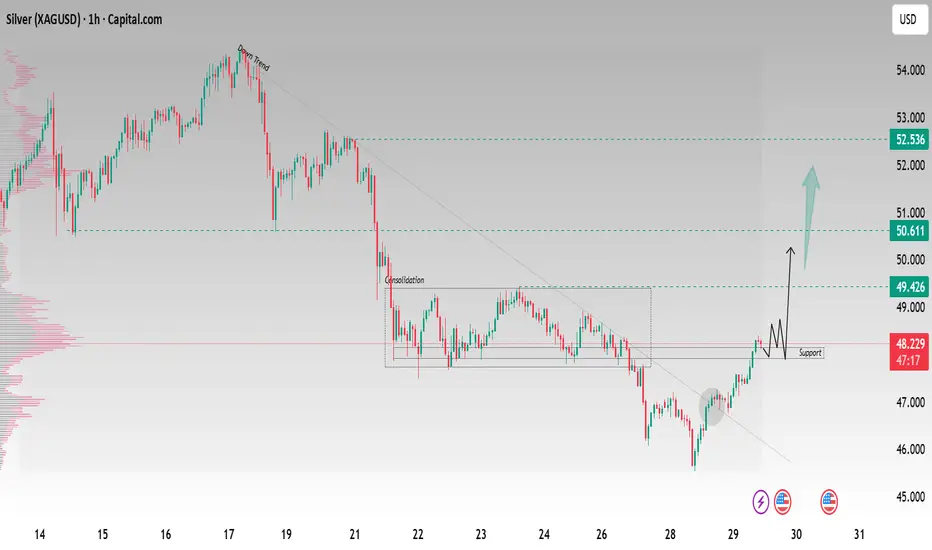
SILVER H1 | Bullish Momentum To ExtendXAG/USD is falling towards the buy entry, which is a pullback support that lines up with the 23.6% Fibonacci retracement and could bounce from this level to the upside.
Buy entry is at 48.28, whichis a pullback support that lines up with the 23.6% Fibonacci retracemnt.
Stop loss is at 47.17, whichis an overlap support that is slightly above the 61.8% Fibonacci retracement.
Take profit is at 50.52, which is a pullback resistance that is slightly below the 61.8% Fibonacci retracement.
Stratos Markets Limited (tradu.com ):
CFDs are complex instruments and come with a high risk of losing money rapidly due to leverage. 68% of retail investor accounts lose money when trading CFDs with this provider. You should consider whether you understand how CFDs work and whether you can afford to take the high risk of losing your money.
Stratos Europe Ltd (tradu.com ):
CFDs are complex instruments and come with a high risk of losing money rapidly due to leverage. 70% of retail investor accounts lose money when trading CFDs with this provider. You should consider whether you understand how CFDs work and whether you can afford to take the high risk of losing your money.

SILVER- ARE YOU READY FOR BIG RALLY?WHY SILVER ?
🟡 1. De-Dollarization and Central Bank Demand
Central banks are buying gold at record levels, especially from emerging economies (China, India, Russia, Türkiye, etc.).
They’re reducing exposure to USD reserves amid rising U.S. debt and weaponization of the dollar (sanctions, SWIFT restrictions).
This steady non-speculative demand floor supports gold prices structurally.
2022–2024 already saw record official purchases — this trend is unlikely to reverse soon.
💵 2. U.S. Fiscal Imbalance and Debt Spiral
The U.S. debt-to-GDP ratio has surpassed 120%, and interest payments alone are nearing $1 trillion/year.
The Fed is trapped: tightening aggressively hurts the economy, while easing fuels inflation and devalues the dollar.
Either scenario (stagflation or monetary easing) is bullish for gold, since gold thrives on negative real yields.
🧩 3. Negative Real Interest Rates (Likely Return)
Once inflation becomes sticky and the Fed pivots (cuts rates), real yields could fall below zero again.
Gold performs best when inflation outpaces nominal rates — as seen in the 1970s and post-2008 cycles.
The 2020s are shaping up similarly: high fiscal spending, supply shocks, and weak productivity = persistent inflation risk.
🌍 4. Geopolitical Tension and Global Fragmentation
Rising geopolitical risks (Middle East, Ukraine, Taiwan Strait) create safe-haven flows.
Gold acts as insurance against systemic shocks.
The world is fragmenting into blocs (BRICS+ vs West), increasing uncertainty — and central banks want neutral reserves (gold fits perfectly).
🧠 5. Technological & Monetary Shifts
Digital currencies (CBDCs) and tokenized gold are making gold more liquid and usable in digital ecosystems.
If gold becomes integrated into digital payment systems (as collateral or backing), it could see renewed monetary relevance.
This could bring a valuation re-rate similar to Bitcoin’s narrative-driven growth.
📈 6. Technical and Historical Perspective
Gold’s long-term chart shows a major cup-and-handle pattern (multi-year formation).
A breakout above $2,400–$2,500 could target $3,000–$3,500 within the next few years.
Historically, gold tends to surge in late-cycle or post-recession phases — exactly where we’re heading.
🧮 7. Portfolio Diversification & ETF Flows
As equity and bond correlations rise, institutional investors seek uncorrelated assets.
Gold fits perfectly in modern risk-parity portfolios.
Expect renewed inflows into gold ETFs and mining stocks once rate cuts begin.

Silver Ascending channel breakdown down trend strong📉 #Silver (XAG/USD) Technical Outlook – 1H Timeframe
⚙️ Price has broken down from the ascending channel, showing clear rejection and strong selling pressure from the resistance area near $49.200.
💥 Bears are gaining momentum, confirming a potential short-term downtrend.
🎯 Technical Targets:
1️⃣ $48.500 – Initial support / 1st target
2️⃣ $47.500 – Secondary bearish objective
3️⃣ $46.000 – Major support zone / Final target
🚨 Bias: Bearish
📊 Structure: Channel breakdown
💪 Momentum: Sellers in control
🕒 Watch for retests of the $49.200 zone for potential short entries with confirmation.
#SilverAnalysis #XAGUSD #Commodities #TechnicalAnalysis #PriceAction

SILVER 4H - double top before the dropAfter a strong rally, silver retested the 49.0–49.5 area aligning with the key 0.618 Fibonacci level. On the 4H chart, we see a clear double-top pattern with falling volume and oscillator divergence. Price already broke below the short-term trendline and failed to hold above resistance - a classic sign of fading bullish momentum.
Fundamentally, silver faces pressure as the dollar stabilizes and rate-cut expectations fade. Industrial demand from Asia is cooling too, reducing the “safe-haven” appeal.
Tactically, while price stays below 49.5, the path of least resistance is down toward 43.8 and possibly 41.1 - key accumulation zones. A breakout above 50.0 would cancel the bearish setup.
Every silver rally ends the same way - right when everyone starts to believe it’ll never end.

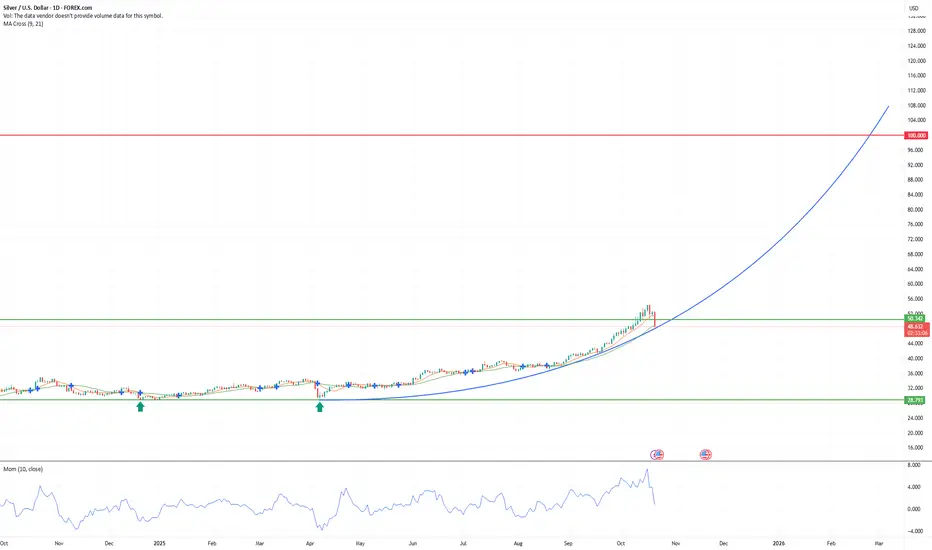
Parabolic pipedream (cont'd)Removed the $70 line doesn't feel right.
This is not a prediction. More just to see if we have gone parabolic or not as it plays out. I happen also to be an idiot and not TA or financial expert. Strongly advise against attempting to trade my ideas.