FCX1Y
RSI is trending down.
MFI is relatively stable sitting between the 25 and 75 range.
5Y
RSI is low and almost oversold.
MFI is trending down.
ALL
RSI is falling.
MFI is falling.
There are gaps around $5-$6.
Prediction: The indicators are bearish. We will fall towards the $5-$6 range.
For my e
1.55 BCHF
19.12 BCHF
1.41 B
About FREEPORT-MCMOR
Sector
Industry
CEO
Richard C. Adkerson
Website
Headquarters
Phoenix
Employees (FY)
27.2 K
Founded
1987
FIGI
BBG006TLQ027
Freeport-McMoRan, Inc. engages in the mining of copper, gold, and molybdenum. It operates through the following segments: North America Copper Mines, South America Mining, Indonesia Mining, Molybdenum Mines, Rod and Refining, Atlantic Copper Smelting and Refining, and Corporate and Other. The North America Copper Mines segment operates open-pit copper mines in Morenci, Bagdad, Safford, Sierrita, Miami in Arizona and Chino, and Tyrone in New Mexico. The South America Mining segment includes Cerro Verde in Peru and El Abra in Chile. The Indonesia Mining segment handles the operations of the Grasberg minerals district that produce copper concentrate containing significant quantities of gold and silver. The Molybdenum Mines segment includes the Henderson underground mine and Climax open pit mine, both in Colorado. The Rod and Refining segment consists of copper conversion facilities located in North America and includes a refinery, and rod mills. The Atlantic Copper Smelting and Refining segment smelts and refines copper concentrate and markets refined copper and precious metals in slimes. The Corporate and Other segment offers other mining and eliminations, oil and gas operations, and other corporate and elimination items. The company was founded by James R. Moffett on November 10, 1987 and is headquartered in Phoenix, AZ.


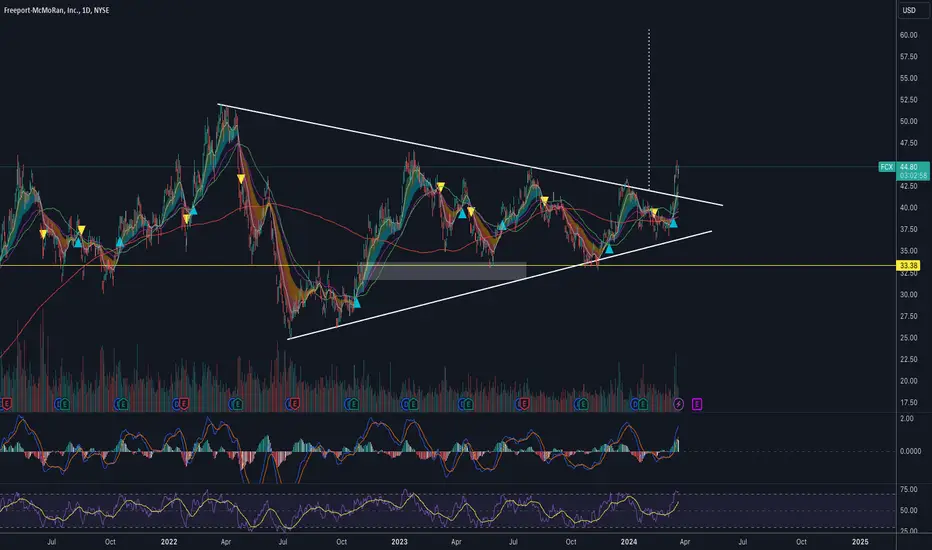
FCX potential buy setupReasons for bullish bias:
- Price has given triangle breakout
- Previously a bullish trend, it most likely would continue
- No divergence
Here are the recommended trading levels:
Entry Level(CMP): 43.46
Stop Loss Level: 35.72
Take Profit Level 1: 51.2
Take Profit Level 2: 58.94
Take Profit Level 3:

FCX: Great Run, Take Your Profits, get ready to reloadNYSE:FCX has had a great run following the recent commodity cycle and global volatility run-up across the commodity spectrum: oil, E&P, GOLD, and fuels.
*The Take*
In the dynamic world of international mining, Freeport-McMoRan stands out as a beacon of resilience and growth. Amidst the ebb and flo

freeport-mcmoran priced in copperThere are some great opportunities out there if you got your eyes open!
For example, what #FreeportMcMoRan is doing versus #Copper is what gold & silver #miners should be doing versus the precious metals, which they are not!
NYSE:FCX AMEX:COPX NYSE:HG #gold #silver

FCX LONGStrength is switching from Tech to Commodity stocks
FCX is gaining stregth relative to other commodity stocks

$FCX - Breaking outNYSE:FCX is breaking out! But I will look to enter on trendline check back.
The measured move is $60.
FCX Long - US Mkt. Trade #1 for 3-18This trade idea assumes that the unusual range move signals a higher probability of a trend continuation, even if there is a short-term reversal. The Edge Finder software suggests that a Limit order of 44.78 on FCX with a 5% stop and a 5% target, a trade which normally has a 50% probability of winni

About to break out of baseFCX has been consolidating for over a year and is building a nice cup base. On Thursday it gapped up to stay above the 50 EMA and is still holding. The bottom of this base is probably in. Great for long term swing.

Possible Long Trade for FCX-FreeportI prefer to go long on NYSE:FCX because of my CAPITALCOM:COPPER expectation ( ). In 2024 growth might slow a bit but with the rate cut expectations looming, Freeport might give some buying oppurtunity as long as S&P 500 entered a bear mode. I don't expect a breakout at the key 46.50 top howev

See all ideas
Trade directly on the supercharts through our supported, fully-verified and user-reviewed brokers.


Curated watchlists where FCX is featured.

Frequently Asked Questions
The current price of FCX is 11.10 CHF — it hasn't changed in the past 24 hours.
Depending on the exchange, the stock ticker may vary. For instance, on SIX exchange FREEPORT-MCMOR stocks are traded under the ticker FCX.
FREEPORT-MCMOR is going to release the next earnings report on Jul 18, 2024. Keep track of upcoming events with our Earnings Calendar.
FCX stock is 0% volatile and has beta coefficient of 1.28. Check out the list of the most volatile stocks — is FREEPORT-MCMOR there?
FCX earnings for the last quarter are 0.23 CHF per share, whereas the estimation was 0.19 CHF resulting in a 16.62% surprise. The estimated earnings for the next quarter are 0.24 CHF per share. See more details about FREEPORT-MCMOR earnings.
FREEPORT-MCMOR revenue for the last quarter amounts to 4.97 B CHF despite the estimated figure of 4.93 B CHF. In the next quarter revenue is expected to reach 5.15 B CHF.
Yes, you can track FREEPORT-MCMOR financials in yearly and quarterly reports right on TradingView.
FCX net income for the last quarter is 426.70 M CHF, while the quarter before that showed 325.83 M CHF of net income which accounts for 30.96% change. Track more FREEPORT-MCMOR financial stats to get the full picture.
Today FREEPORT-MCMOR has the market capitalization of 63.04 B, it has decreased by 0.59% over the last week.
Yes, FCX dividends are paid quarterly. The last dividend per share was 0.14 CHF. As of today, Dividend Yield (TTM)% is 1.25%. Tracking FREEPORT-MCMOR dividends might help you take more informed decisions.
FREEPORT-MCMOR dividend yield was 1.41% in 2023, and payout ratio reached 47.00%. The year before the numbers were 1.58% and 25.16% correspondingly. See high-dividend stocks and find more opportunities for your portfolio.
Like other stocks, FCX shares are traded on stock exchanges, e.g. Nasdaq, Nyse, Euronext, and the easiest way to buy them is through an online stock broker. To do this, you need to open an account and follow a broker's procedures, then start trading. You can trade FREEPORT-MCMOR stock right from TradingView charts — choose your broker and connect to your account.
As of Apr 25, 2024, the company has 27.20 K employees. See our rating of the largest employees — is FREEPORT-MCMOR on this list?
Investing in stocks requires a comprehensive research: you should carefully study all the available data, e.g. company's financials, related news, and its technical analysis. So FREEPORT-MCMOR technincal analysis shows the sell today, and its 1 week rating is sell. Since market conditions are prone to changes, it's worth looking a bit further into the future — according to the 1 month rating FREEPORT-MCMOR stock shows the sell signal. See more of FREEPORT-MCMOR technicals for a more comprehensive analysis.
If you're still not sure, try looking for inspiration in our curated watchlists.
If you're still not sure, try looking for inspiration in our curated watchlists.
We've gathered analysts' opinions on FREEPORT-MCMOR future price: according to them, FCX price has a max estimate of 54.95 CHF and a min estimate of 35.90 CHF. Read a more detailed FREEPORT-MCMOR forecast: see what analysts think of FREEPORT-MCMOR and suggest that you do with its stocks.
EBITDA measures a company's operating performance, its growth signifies an improvement in the efficiency of a company. FREEPORT-MCMOR EBITDA is 7.81 B CHF, and current EBITDA margin is 35.90%. See more stats in FREEPORT-MCMOR financial statements.