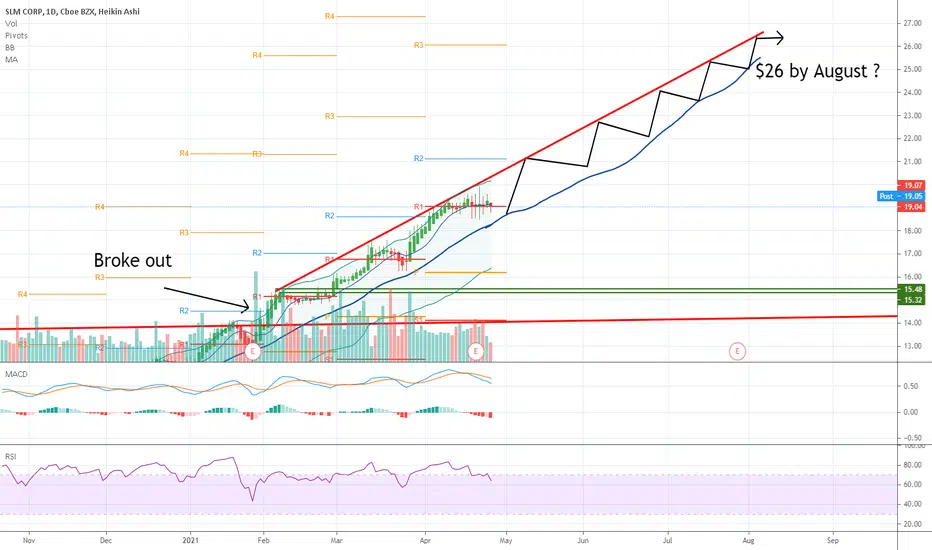
SLM CorporationEntry only if the resistance line breaks!
Take profit and Stop loss are marked on the chart.
Good Luck!
2.43USD
581.39 MUSD
2.89 BUSD
216.84 M
About SLM Corporation
Sector
Industry
CEO
Jonathan W. Witter
Website
Headquarters
Newark
Employees (FY)
1.74 K
Founded
1972
ISIN
US78442P1066
FIGI
BBG000BBCQD7
SLM Corp. engages in the provision and administration of education loans. Its services include private education loans, banking, college savings, and insurance services. The company was founded in 1972 and is headquartered in Newark, DE.

SLM - Trying to break thru 100ma resistanceSLM seems to be struggling at the 100ma mark. I think it should not be long before it pushes through and looks for new highs around the 21 level.
I bought the Jan $21 call for .25

Student Loans Business a WinnerSallie Mae specialises in providing private loans to students and seems to be doing very well out of it. The stock price is up 200% over the last 12 months and with a recent pullback could be a good time to have a look around for an entry if the business appeals to you.

US Stock In Play: $SLM (SLM Corporation)$SLM gained a further +5.17%, via a second display of Open Drive price action behavior within the last 10 trading session. Since the start of 2021, $SLM have accumulated a total gain of +43.10%, with majority of the gains effected from the rebound back above its 20DMA on 28th January 2021 onwards.

SLM Breakout WatchSLM wanted to break out but bad market conditions held it back. Still closed above previous resistance which is a good sign if it holds as support. Watching for another breakout with a tight stop loss below the bottom trendline. SL less around 1%


$SLM Double top - still in channel3 month long channel on $SLM
20% drop is big... but still in line with price action.
Anything below $6.50 is cause for concern in the next 2 weeks.
RSI on the daily is almost oversold. Would expect the selling to slow in the next 3-5 trading days.
Patience is key.

$SLM,, Soild uptrend I can see this company is doing well and it is a good entry now with PT to 9-10 within 4 weeks

SLM , Good buy but not just yet...
Great company to pay attention to...
After positive earnings (April 22nd) SLM ran up an it looks like its on the down run back to support on technical . Great candidate for swing trade but wait for it to return to support first .
Also, keep and eye on short float at that time as its currently

See all ideas
Trade directly on the supercharts through our supported, fully-verified and user-reviewed brokers.


Frequently Asked Questions
The current price of SLM is 20.78 USD — it has increased by 0.97% in the past 24 hours.
Depending on the exchange, the stock ticker may vary. For instance, on NASDAQ exchange SLM Corporation stocks are traded under the ticker SLM.
SLM Corporation is going to release the next earnings report on Apr 24, 2024. Keep track of upcoming events with our Earnings Calendar.
SLM stock is 2.64% volatile and has beta coefficient of 1.37. Check out the list of the most volatile stocks — is SLM Corporation there?
One year price forecast for SLM Corporation has a max estimate of 26.00 USD and a min estimate of 22.00 USD.
SLM earnings for the last quarter are 0.11 USD whereas the estimation was 0.35 USD which accounts for −68.72% surprise. Estimated earnings for the next quarter are 0.88 USD. See more details about SLM Corporation earnings.
SLM Corporation revenue for the last quarter amounts to 409.00 M USD despite the estimated figure of 419.09 M USD. In the next quarter revenue is expected to reach 454.38 M USD.
Yes, you can track SLM Corporation financials in yearly and quarterly reports right on TradingView.
SLM stock has fallen by 0.62% compared to the previous week, the month change is a 1.46% rise, over the last year SLM Corporation has showed a 43.91% increase.
SLM net income for the last quarter is 168.44 M USD, while the quarter before that showed 29.37 M USD of net income which accounts for 473.62% change. Track more SLM Corporation financial stats to get the full picture.
Today SLM Corporation has the market capitalization of 4.53 B, it has increased by 1.56% over the last week.
Yes, SLM dividends are paid quarterly. The last dividend per share was 0.11 USD. As of today, Dividend Yield (TTM)% is 2.14%. Tracking SLM Corporation dividends might help you take more informed decisions.
SLM Corporation dividend yield was 2.30% in 2023, and payout ratio reached 18.27%. The year before the numbers were 2.65% and 25.01% correspondingly. See high-dividend stocks and find more opportunities for your portfolio.
Like other stocks, SLM shares are traded on stock exchanges, e.g. Nasdaq, Nyse, Euronext, and the easiest way to buy them is through an online stock broker. To do this, you need to open an account and follow a broker's procedures, then start trading. You can trade SLM Corporation stock right from TradingView charts — choose your broker and connect to your account.
As of Apr 19, 2024, the company has 1.74 K employees. See our rating of the largest employees — is SLM Corporation on this list?
Investing in stocks requires a comprehensive research: you should carefully study all the available data, e.g. company's financials, related news, and its technical analysis. So SLM Corporation technincal analysis shows the neutral today, and its 1 week rating is buy. Since market conditions are prone to changes, it's worth looking a bit further into the future — according to the 1 month rating SLM Corporation stock shows the buy signal. See more of SLM Corporation technicals for a more comprehensive analysis.
If you're still not sure, try looking for inspiration in our curated watchlists.
If you're still not sure, try looking for inspiration in our curated watchlists.
We've gathered analysts' opinions on SLM Corporation future price: according to them, SLM price has a max estimate of 26.00 USD and a min estimate of 22.00 USD. Read a more detailed SLM Corporation forecast: see what analysts think of SLM Corporation and suggest that you do with its stocks.
EBITDA measures a company's operating performance, its growth signifies an improvement in the efficiency of a company. SLM Corporation EBITDA is 1.48 B USD, and current EBITDA margin is 51.19%. See more stats in SLM Corporation financial statements.