Falling wedges: Are you convinced now about what's to come?Yes, we are still in a downtrend, but this is not the first time this happens. Maybe this chart will convince you why.
The upcoming two weeks will become very important on what's next for COINBASE:SOLUSD : will a breakout occur on this last falling wedge just like previous times?
I think it will

SOL to $4500?Internet Capital Markets
I believe Solana is going to take over the entire financial system.

SOL PERPETUAL TRADE BUY SETUP Long from $144SOL PERPETUAL TRADE
BUY SETUP
Long from $144
Currently $144
Targeting $148.80 or Above
(Trading plan IF SOL
go down to $140 will add more longs)
Follow the notes for updates
In the event of an early exit,
this analysis will be updated.
Its not a Financial advice

Capital Flows Impacted1. Understanding Capital Flows
Capital flows are broadly classified into two categories:
Foreign Direct Investment (FDI):
Long-term investments in physical assets like factories, infrastructure, or real estate. FDI represents stable and sustainable investment because it indicates confidence in the

Ascending triangle formed!I think that an uptrend has become inevitable from here. 158$ marks our new support for Solana (BTCUSD already marked it).
We will again see some retracement at 175$. When we breakout of the big descending channel , a way higher price becomes inevitable too. I’m sure that the big cup and handle p

SOLANA entered into bearish territory, targeting $105.Solana (SOLUSD) closed last week below its 1W MA50 (blue trend-line) for the first time since July 28 2025. This is an extension of the downtrend that started following the September 15 High, which took place right below the Resistance Zone that started back on the November 2021 Cycle Top.
This is

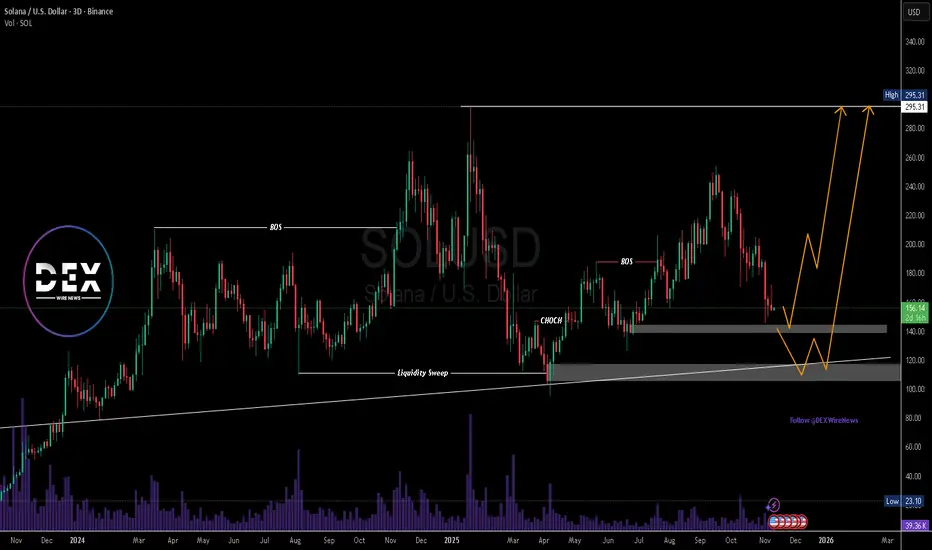
$SOLUSD Eyes Key Demand Zone Before Potential Macro BreakoutSolana (SOL/USD) is approaching a pivotal technical zone that could define its next major move. After an extended corrective leg from the $254 region, the price has retraced toward key demand areas, around $140, and around $120 where prior liquidity sweeps and structural reversals have historically
SOLANA TECHNICAL UPDATE (4H Chart)
After months of bullish momentum, SOL/USD just broke below the trendline — showing early signs of bearish reversal.
📉 Setup Idea:
Price broke trendline support
Now retesting the $174–182 resistance zone
If rejection confirms, next targets →
🎯 TP1: $140
🎯 TP2: $95–100
⚠️ Invalidation:
If price

Double top after ascending triangle: 163$ will be retestedDouble top occurred at COINBASE:BTCUSD and at $COINBASE:SOLUSD. 163$ will be retested. I think we will see a bounce from there.

SOLUSD - Bullish Structure eyeing 160+ TargetPrice is currently retesting a key resistance zone around 158.20–158.60, an area that has rejected price multiple times. The market has formed a series of higher lows, showing increasing bullish momentum as buyers continue to step in earlier on each pullback.
If price can break and close above this

See all ideas
Summarizing what the indicators are suggesting.
Oscillators
Neutral
SellBuy
Strong sellStrong buy
Strong sellSellNeutralBuyStrong buy
Oscillators
Neutral
SellBuy
Strong sellStrong buy
Strong sellSellNeutralBuyStrong buy
Summary
Neutral
SellBuy
Strong sellStrong buy
Strong sellSellNeutralBuyStrong buy
Summary
Neutral
SellBuy
Strong sellStrong buy
Strong sellSellNeutralBuyStrong buy
Summary
Neutral
SellBuy
Strong sellStrong buy
Strong sellSellNeutralBuyStrong buy
Moving Averages
Neutral
SellBuy
Strong sellStrong buy
Strong sellSellNeutralBuyStrong buy
Moving Averages
Neutral
SellBuy
Strong sellStrong buy
Strong sellSellNeutralBuyStrong buy
Curated watchlists where SOLUSD.P is featured.

Gen 3 crypto: A new day dawns…
25 No. of Symbols

Smart contracts: Make the smart decision
36 No. of Symbols

Staking Coins: Pick up a stake
18 No. of Symbols

Top altcoins: Choose your alternatives carefully
28 No. of Symbols

Up-and-coming crypto: New kids on the block
30 No. of Symbols
See all sparks