Five Bubbles, One ChartEvery Bubble Peaks Near 40%
This chart puts five manias side by side on one scale. Utilities and industrials in the 1920s, the Nifty Fifty, Japan, the dot-com era, and AI (Artificial Intelligence). Each curve is the share of the market held by that era's leaders: the climb, the peak, the collapse.
SPX 500, Daily
No trades
No trades
Index info
Standard and Poor's 500 Index is a capitalization-weighted index of 500 stocks. The index is designed to measure performance of the broad domestic economy through changes in the aggregate market value of 500 stocks representing all major industries. The index was developed with a base level of 10 for the 1941-43 base period.
S&P 500 Looks Very Bullish (3H)From the point where we placed the red arrow on the chart, a corrective structure has been developing on the .
Based on the current price action and the internal structure of the correction, this movement appears to be forming a Double Combination. The market has already completed a significant po
SPX500 1H:Bearish Rejection Resistance Area & Channel BreakdownSPX500 1H: Bearish Rejection at Resistance Area & Channel Breakdown
SPX500 (TVC:SPX500) has rejected the upper Resistance Area (7,800.0 - 7,830.0) on the 1H timeframe and broken below its primary ascending channel support. Price is currently consolidating near 7,779.3, following a clear downward str
S&P 500: The 12-Month Target of Institutional InvestorsIn an analysis published on TradingView last week, I explained the main reason behind the continuation of the stock market’s underlying uptrend: valuation.
Corporate profits and earnings prospects for S&P 500 companies are so substantial that, despite the index reaching new record highs, the stock
Hellena | SPX500 (4H): LONG to the 7880.0 resistance area.The bullish SPX500 scenario remains valid. The current price action suggests that higher-degree wave "1" is still developing, and the final stage of the advance may extend further than previously anticipated.
Following the completion of intermediate wave "4" at 7519.3, price resumed its advance. I
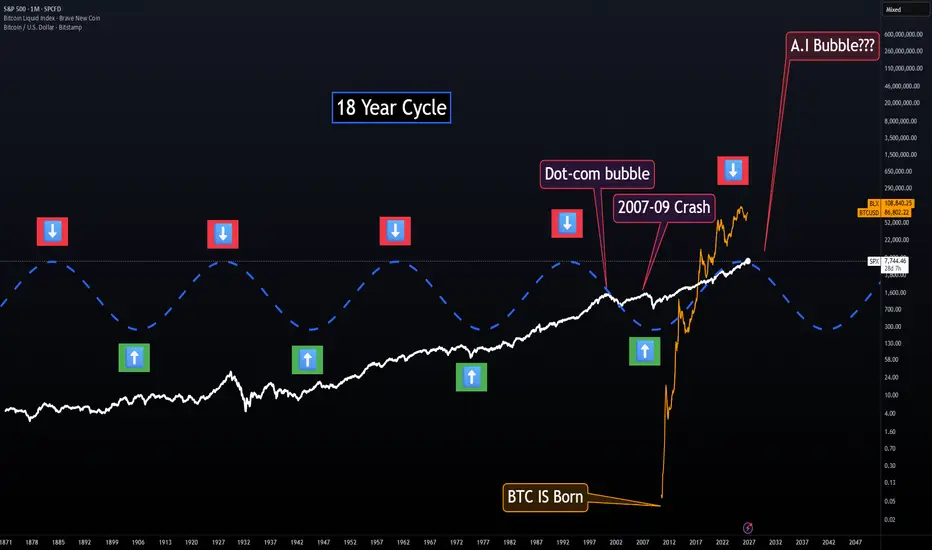
18-Year Cycle — Visual ModelThis is an easy-to-read visual version of my 18-Year Cycle model.
If you’re a visual person like me, this unfinished version makes the cycle much easier to see. The green arrows represent the stronger/good periods of the cycle, while the red arrows represent the higher-risk periods where major mark
Going over todays price action on the markets 10/05/26On todays video I go over with subscribers my levels of support and resistance and what I make out of the price action today. There are warning signs in the charts and also something isn't right and something is a miss in the markets, I believe we will find out soon!
SPX Time@Mode #4: second bar held, minutes nextGM gents,
Follow-up to #3. Last Monday the weekly signal had just fired on the 9/25 close and PCE and NFP were next. Both came in soft, core PCE +0.2% on the month against +0.3% expected and September payrolls +29K, and the second bar of the signal closed Friday at 7,722.72. Thursday traded down to
See all ideas
Displays a symbol's value movements over previous years to identify recurring trends.
Frequently asked questions
SPX 500, Daily reached its highest quote on Oct 6, 2026 — 7,844.38 USD. See more data on the SPX 500, Daily chart.
The lowest ever quote of SPX 500, Daily is 2,032.68 USD. It was reached on Nov 9, 2016. See more data on the SPX 500, Daily chart.
SPX 500, Daily is just a number that lets you track performance of the instruments comprising the index, so you can't invest in it directly. But you can buy SPX 500, Daily futures or funds or invest in its components.