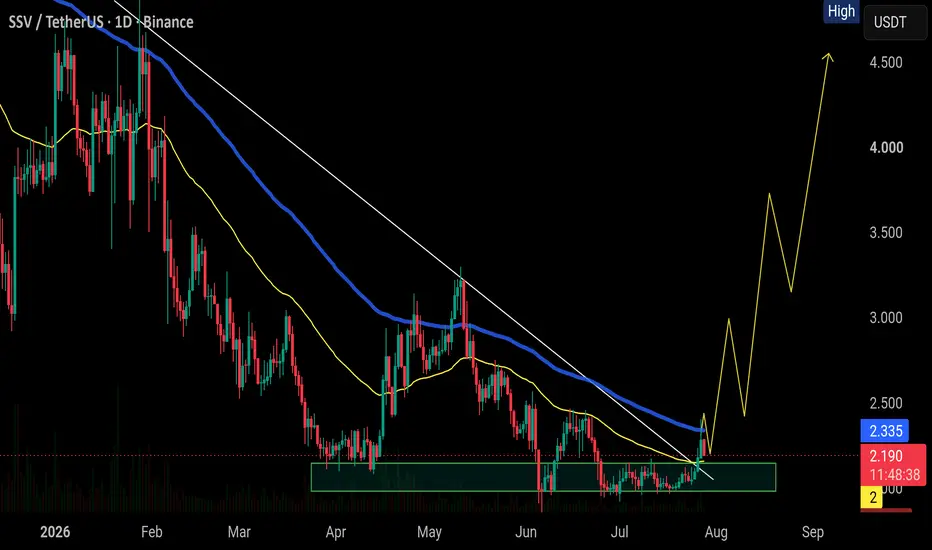
SSV has broken out of the long downtrend and is now holding abovTSXV:SSV LONG-TERM SETUP 📈
SSV has broken out of the long downtrend and is now holding above the breakout area.
The key support zone is around $2.00–$2.60. As long as price holds above this area, the structure remains bullish.
If SSV continues building higher highs, $3.50 is the first major leve
SSV/USDT (4h) Testing an Ascending Triangle BreakoutSSV/USDT is consolidating inside an ascending triangle on the 4H chart, with price forming a sequence of higher lows against a relatively flat resistance zone around $2.78–$2.80.
Price is now testing and slightly pushing above this resistance area. A confirmed breakout and hold above $2.80 could tr
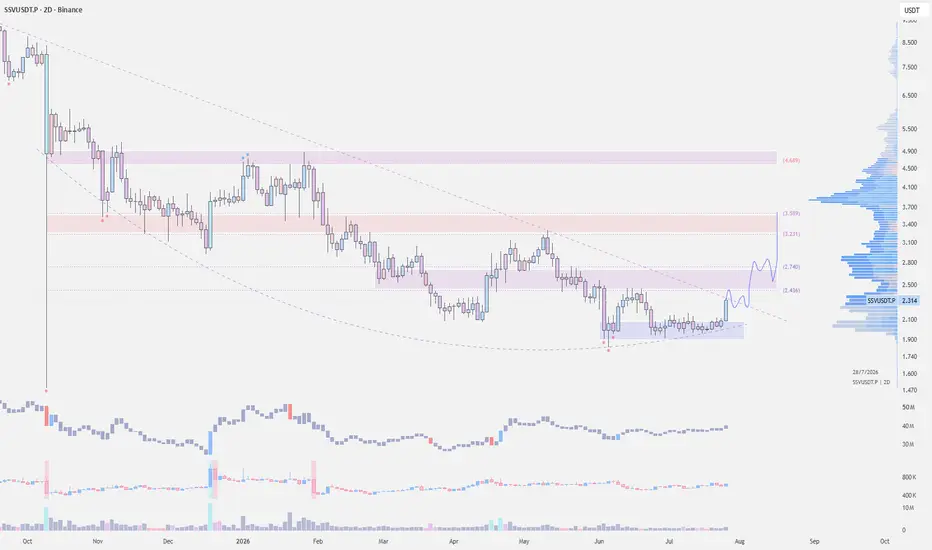
$SSV update: The setup still looks good to me. Today's pullbackTSXV:SSV update:
The setup still looks good to me. Today's pullback doesn't change much as long as $2.00 continues to hold.
I'm still watching $2.34 as the key level. Once we reclaim it and turn it into support, I think the next leg up can begin.
For now, nothing has changed. As long as $2.00 ho
$SSV - Bullish Structure HoldingBINANCE:SSVUSDT is starting to look interesting here.
Price broke out with a strong bullish impulse and is now consolidating above the breakout zone. As long as it holds the current range, momentum remains in favor of the bulls.
The key level is $2.20. If price continues to hold above it, I think
$SSV is finally showing signs of life. It's starting to look inTSXV:SSV is finally showing signs of life.
It's starting to look interesting, but I'm not getting excited just yet.
If price can reclaim $2.34 and actually hold above it, I think that's when the real move begins. From there, I wouldn't be surprised to see it work its way toward the $4+ area.
Unt
SSV USDT LONG SIGNAL#127. SSV /USDT – Trade Setup (LONG)
📈 Position Type: LONG
🕒 Timeframe: 1H
📊 Market: Futures
💰 Entry Zone:
2.090
🛑 Stop-Loss:
2
🎯 Take-Profit Targets:
• TP1: 2.146
• TP2: 2.210
• TP3: 2.278
• TP4: 2.360
⚙️ Leverage:
5 *10
▫️ After TP1, move SL to Entry + 0.2%.
▪️ Exit Plan:
• 40%
SSV Enters a Bearish Wave (4H)It looks like a bullish diametric structure on SSV has likely come to an end. Price now appears to be entering a bearish phase of similar degree to the completed bullish structure, which suggests that SSV could remain in a bearish environment for several weeks.
We have identified a flip zone on the
KEEP AN EYE ON SSV🔥 Fortune AI Radar — TSXV:SSV
Fresh activity detected on TSXV:SSV today.
Data suggests increasing market interest & buyers stepping in.
Technicals currently lean bullish, with momentum trending upward.
Whales showing hints of accumulation and hype rising among traders.
This coin is flashing st
SSVUSDT Forming Falling WedgeSSVUSDT is forming a clear falling wedge pattern, a classic bullish reversal signal that often indicates an upcoming breakout. The price has been consolidating within a narrowing range, suggesting that selling pressure is weakening while buyers are beginning to regain control. With consistent volume
See all ideas
Summarizing what the indicators are suggesting.
Oscillators
Neutral
Oscillators
Neutral
Summary
Neutral
Summary
Neutral
Summary
Neutral
Moving Averages
Neutral
Moving Averages
Neutral
Displays a symbol's price movements over previous years to identify recurring trends.