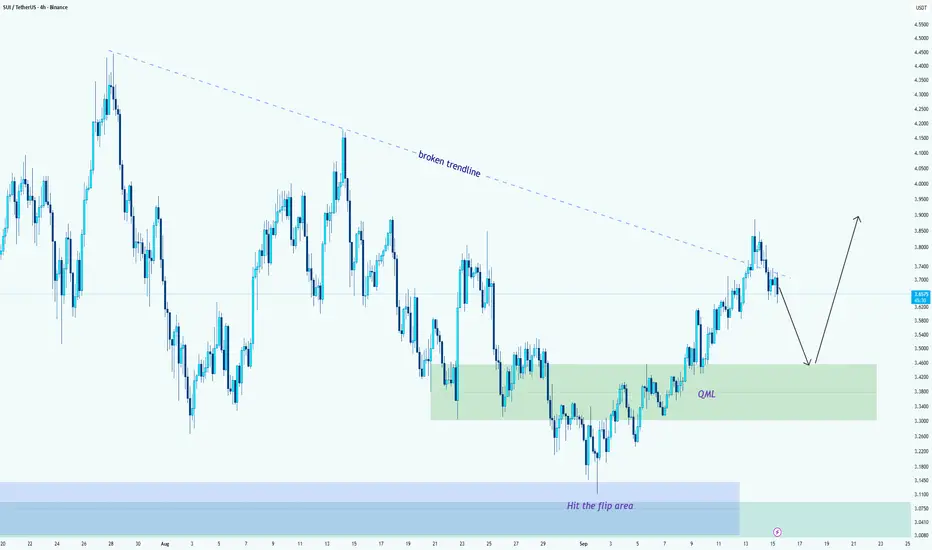
SUI/USDT --> Two-Step Setup: Retest QML, Then RallyHello guys!
Short version first: I expect a pullback to the QML (3.30–3.45), then a bounce that resumes the upside toward 3.80–3.90 (and potentially higher if momentum continues).
Why this makes sense (the plan):
Step 1 --> Pullback to QML:
Price broke the long descending trendline and i
Sui (SUI): Expecting 200% Market price Movement Very SoonSUI has a sleeper setup, which can give us potentially 200% of movement very, very soon. We are in a bullish trend so expecting a bounce from here.
More in-depth info is in the video—enjoy!
Swallow Academy

#SUI/USDT → Resistance breakout and entry into the buying zone#SUI
The price is moving within a descending channel on the 1-hour frame, adhering well to it, and is heading for a strong breakout and retest.
We have a bearish trend on the RSI indicator that is about to be broken and retested, which supports the upward breakout.
There is a major support area i

$sui long well playedCRYPTOCAP:SUI jumped exactly from our entry and good 17% profit if you entered long with leverage then congratulations for listening to my call.
Taking partial profits here.

SUI Game Plan - Suinetwork📊 Market Sentiment
Market sentiment remains strongly bullish as the FED is expected to deliver a 0.25% rate cut, with speculation building for a possible 0.5% cut in September. Monetary policy shifts are being driven by both inflation trends and weakening labor market data. The latest August and S
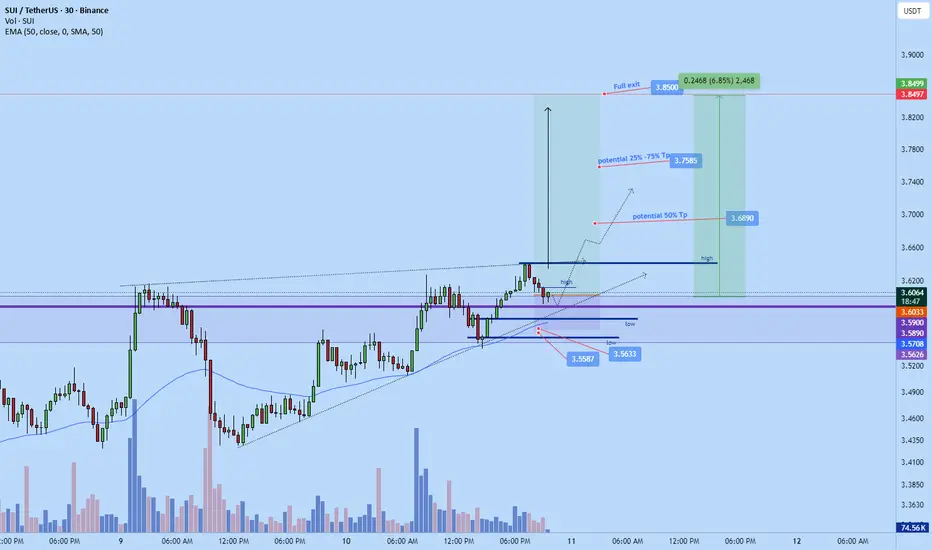
SUI BIG LONG NOW!!!URGENTJust took this sui long a while ago..Might not exactly be ready yet but soon. If we push its likely gonna fly aggressively to $3.85 area
sl: 3.5633 area - $3.5587 or lower . Ideally 3.5385 if conservative
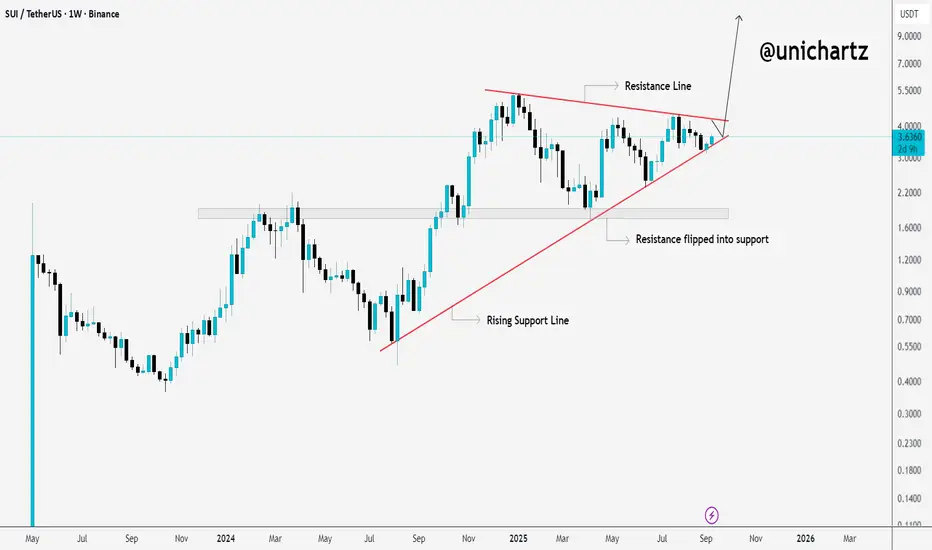
SUI at a Crossroads: Next Move Could Be HugeCRYPTOCAP:SUI has been moving inside a big triangle pattern, with rising support holding the lows and strong resistance capping the highs. Notice how the old resistance around $1.60 has already flipped into support, a healthy sign showing buyers are still in control.
Right now, SUI is sitting at t
SUI | Watching for Key Resistance Flip — Long Setup BuildingDescription:
Sui (SUI) is shaping up for a potential bullish continuation, with price action currently hovering just below a critical resistance zone. A confirmed break and retest of this level could open the door for a strong upside move.
📍 Trade Setup:
Entry Zone: $3.40 – $3.60
Stop Loss: Just

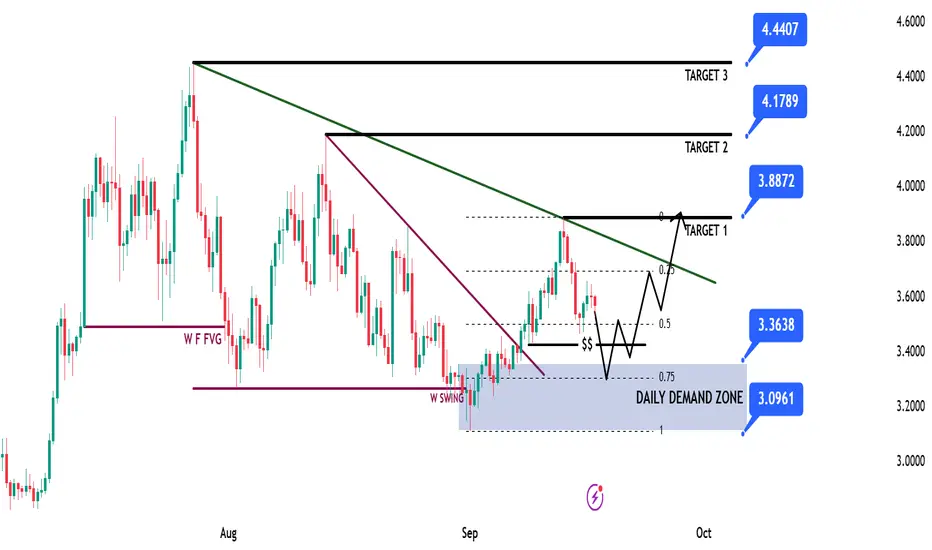
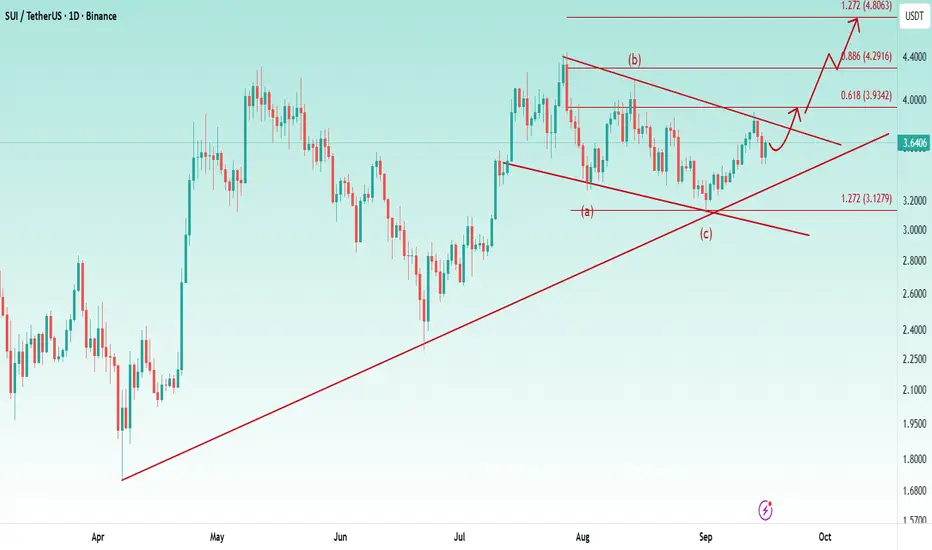
perfect bullish structure formed at the chart 👉 There is a strong bullish structure as the price has perfectly bounced from the 1.272% Fibonacci level and the trendline. A bullish flag is also forming on the chart, and I expect a breakout from this flag soon. Totally the structure is bullish for me
✅ Targets : 3.93$, 4.3$ And 4.8$
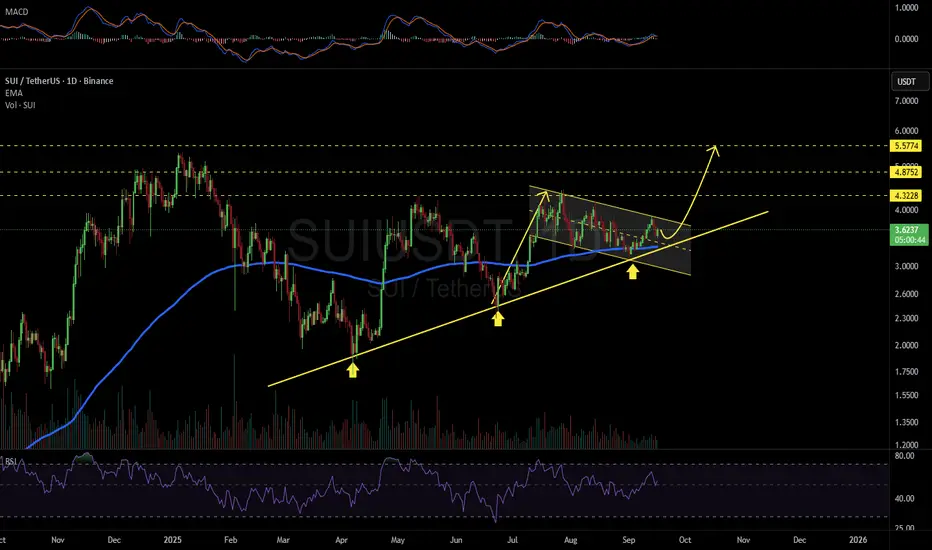
SUIUSDT 1D#SUI is moving within a bullish flag pattern on the daily chart and is currently holding above the flag’s midline and the daily EMA200. If it breaks out above the flag resistance, the potential targets are:
🎯 $4.3228
🎯 $4.8752
🎯 $5.5774
⚠️ Always remember to use a tight stop-loss and follow proper
See all ideas
Summarizing what the indicators are suggesting.
Oscillators
Neutral
SellBuy
Strong sellStrong buy
Strong sellSellNeutralBuyStrong buy
Oscillators
Neutral
SellBuy
Strong sellStrong buy
Strong sellSellNeutralBuyStrong buy
Summary
Neutral
SellBuy
Strong sellStrong buy
Strong sellSellNeutralBuyStrong buy
Summary
Neutral
SellBuy
Strong sellStrong buy
Strong sellSellNeutralBuyStrong buy
Summary
Neutral
SellBuy
Strong sellStrong buy
Strong sellSellNeutralBuyStrong buy
Moving Averages
Neutral
SellBuy
Strong sellStrong buy
Strong sellSellNeutralBuyStrong buy
Moving Averages
Neutral
SellBuy
Strong sellStrong buy
Strong sellSellNeutralBuyStrong buy
Displays a symbol's price movements over previous years to identify recurring trends.