SUI/USDT Long to Rebalance 1.89 FVG/BSLA clear 4H bearish gap formed after the displacement down from 1.89.
Targeting the 1.89 fair value gap for rebalance.
Entry from discount, draw on liquidity above.
Related pairs

SUIUSDT | Swing Buy Opportunity (Educational Idea)📌 Buy Zone (DCA Strategy)
I’m planning to accumulate SUI inside the 1.50 – 1.20 USD demand zone using a DCA structure:
Entry 1: 1.50
Entry 2: 1.40
Entry 3: 1.30
(DCA helps average the entry during volatility inside the zone.)
⛔ Stop Loss
Weekly candle close below 1.20 USD
A confirmed weekly b

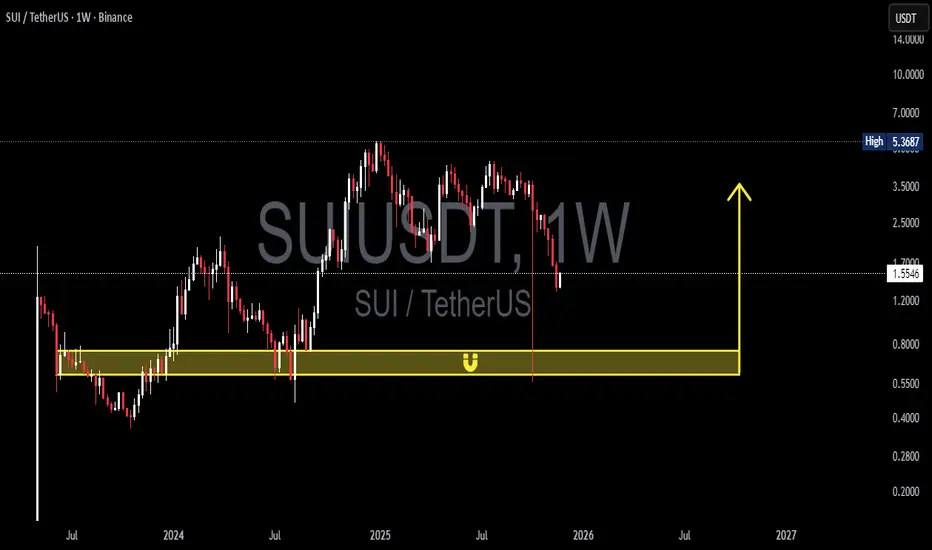
SUI/USDT — Massive Accumulation or Full Capitulation?SUI is standing right at the gateway where its entire macro cycle will be decided.”
The weekly chart reveals something uncommon: a sharp drop, deep liquidity sweep, and precise retest of the historical demand zone at 0.75–0.60 — the exact area that launched SUI’s major rally back in early 2024.
Mo
SUI — This Chart Still Wants HigherAlright, guys.
SUI is holding its bullish structure perfectly. The chart looks like it’s loading energy for the next move, and the momentum is still on the bulls’ side.
Here are my levels:
🎯 Target 1: 1.66
🎯 Target 2: 1.78
🎯 Target 3: 1.92
❌Invalidation:
Close below 1.54 → idea cancelled, bears ta

#SUI/USDT Could switch sides soon. Be ready#SUI
The price is moving in a descending channel on the 1-hour timeframe and is expected to break out and continue upwards.
We have a trend to stabilize above the 100-period moving average again.
We have a downtrend on the RSI indicator, which supports an upward move if it breaks above it.
We ha

SUI/USDT : SELL LIMIT
Hello friends
you can see that the price is moving in a range with a slight upward slope, and every time it hits the specified support, the power of buyers decreases, and now, in the last hit that we have identified, it seems that the price will not be able to record a higher ceiling and we will w

$SUI - Long term AnalysisShared MSS (Bear market) confirmed when this shitcoin was around $3.20.
now this is the bigger picture for the coming months..
(Nothing Guaranteed, It's just a scenario)

SUI/USDT Could switch sides soon. Be readySUI/USDT on the 1H chart appears to have completed a downward correction. The price action has followed a large descending channel and what looks like a corrective structure, ending with a final five-wave move.
Key Levels
Potential Entry: Upon confirmation of the breakout above $1.62.
Target 1:

SUI TA (Y25.P4.Video1). Complete technical approachHi Traders,
Besides being an educational piece on how I approach the charts, we will dive into what is likely to play out from an Elliott Wave perpective and using support and resistance methods to find confluence with our fibonacci approach for levels to short and long.
I promise you newbies or i

SUI/USDT:LIVE TRADEHello friends
First of all, I must say that risk and capital management should be observed and any decision-making is your responsibility.
Given the decline we had, we now see that buyers have entered and are one by one setting higher ceilings and floors, which will cause the price to rise to the

See all ideas
Summarizing what the indicators are suggesting.
Oscillators
Neutral
SellBuy
Strong sellStrong buy
Strong sellSellNeutralBuyStrong buy
Oscillators
Neutral
SellBuy
Strong sellStrong buy
Strong sellSellNeutralBuyStrong buy
Summary
Neutral
SellBuy
Strong sellStrong buy
Strong sellSellNeutralBuyStrong buy
Summary
Neutral
SellBuy
Strong sellStrong buy
Strong sellSellNeutralBuyStrong buy
Summary
Neutral
SellBuy
Strong sellStrong buy
Strong sellSellNeutralBuyStrong buy
Moving Averages
Neutral
SellBuy
Strong sellStrong buy
Strong sellSellNeutralBuyStrong buy
Moving Averages
Neutral
SellBuy
Strong sellStrong buy
Strong sellSellNeutralBuyStrong buy
Displays a symbol's price movements over previous years to identify recurring trends.
Frequently Asked Questions
The current price of SUI / UST (SUI) is 1.50330000 USDT — it has risen 0.17% in the past 24 hours. Try placing this info into the context by checking out what coins are also gaining and losing at the moment and seeing SUI price chart.
SUI / UST price has risen by 9.98% over the last week, its month performance shows a −39.15% decrease, and as for the last year, SUI / UST has decreased by −56.28%. See more dynamics on SUI price chart.
Keep track of coins' changes with our Crypto Coins Heatmap.
Keep track of coins' changes with our Crypto Coins Heatmap.
SUI / UST (SUI) reached its highest price on Oct 20, 2024 — it amounted to 15.00000000 USDT. Find more insights on the SUI price chart.
See the list of crypto gainers and choose what best fits your strategy.
See the list of crypto gainers and choose what best fits your strategy.
SUI / UST (SUI) reached the lowest price of 0.36247000 USDT on Oct 19, 2023. View more SUI / UST dynamics on the price chart.
See the list of crypto losers to find unexpected opportunities.
See the list of crypto losers to find unexpected opportunities.
The safest choice when buying SUI is to go to a well-known crypto exchange. Some of the popular names are Binance, Coinbase, Kraken. But you'll have to find a reliable broker and create an account first. You can trade SUI right from TradingView charts — just choose a broker and connect to your account.
Crypto markets are famous for their volatility, so one should study all the available stats before adding crypto assets to their portfolio. Very often it's technical analysis that comes in handy. We prepared technical ratings for SUI / UST (SUI): today its technical analysis shows the sell signal, and according to the 1 week rating SUI shows the sell signal. And you'd better dig deeper and study 1 month rating too — it's strong sell. Find inspiration in SUI / UST trading ideas and keep track of what's moving crypto markets with our crypto news feed.
SUI / UST (SUI) is just as reliable as any other crypto asset — this corner of the world market is highly volatile. Today, for instance, SUI / UST is estimated as 1.98% volatile. The only thing it means is that you must prepare and examine all available information before making a decision. And if you're not sure about SUI / UST, you can find more inspiration in our curated watchlists.
You can discuss SUI / UST (SUI) with other users in our public chats, Minds or in the comments to Ideas.