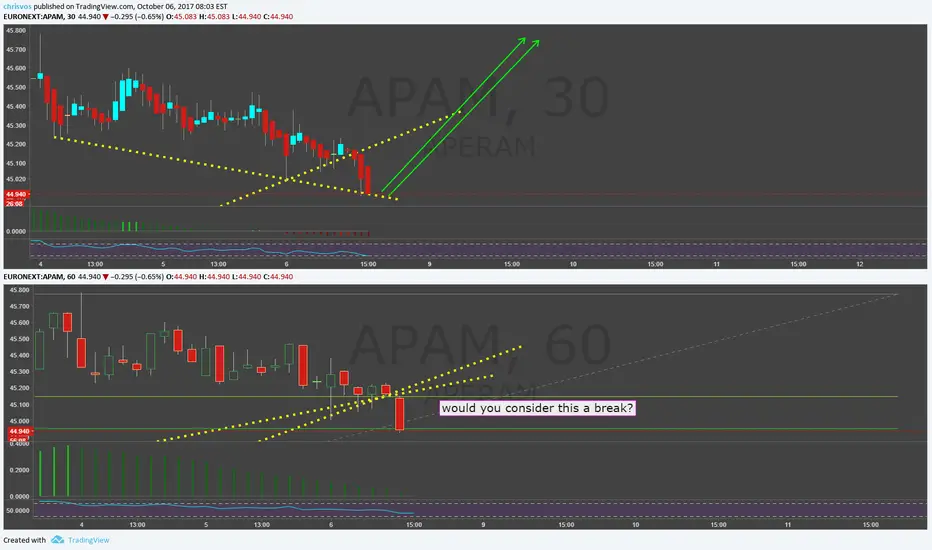
APERAM - Ready to move higherAPERAM shows interesting features, like a short term bullish trend a pull back to the MA Ribbon support and a bullish day candle today: a buy opportunity once range breakout is confirmed.
2.735EUR
198.84 MEUR
6.46 BEUR
About APERAM S.A. SHARES
Sector
Industry
CEO
Timoteo di Maulo
Website
Headquarters
Luxembourg
Employees (FY)
11.5 K
Founded
2010
ISIN
US03754H1041
FIGI
BBG001F4F693
Aperam SA engages in the production of steel and value added products. It operates through the following segments: Stainless and Electrical Steel, Services and Solutions, Alloys and Specialties, and Recycling. The Stainless and Electrical Steel segment produces grain and non-grain oriented steel products. The Services and Solutions segment includes the tubes business. The Alloys and Specialties segment is involved in the design, manufacture, and transformation of specialty alloys and certain specific stainless steels. The Recycling segment recycles stainless steel scrap and superalloys. The company was founded on September 9, 2010 and is headquartered in Luxembourg.


Aperam: ShortLower lows, lower highs. Don't fight the trend.
It had a nice run this month, but now it's oversold, might need to cool off.
Rising wedge and strong resistance.

4th Trade: APERAM and its Unusual VolumeShorting Amsterdam listed Aperam (APAM) is the 4th trade in the challenge. Unusual volume was the first reason this stock caught my eye. Before its most recent pullback, the stock's volume increased heavily (indicating possible insider selling). Coupled with a short on the B52 Strategy and the Alpha


Aperam Q3 EBITDA lower than expected, overall outlook still upThe revenue of Aperam in Q3 showed us lower ebitda/revenue than analysts expected. Still they managed to reduce debt and the outlook for Q4 is positive. Today a gap of -8% and it already filled the gap all the way up the opening. For now I anticipate on more upside.


See all ideas
Trade directly on the supercharts through our supported, fully-verified and user-reviewed brokers.


Frequently Asked Questions
The current price of 7AAN is 28.80 EUR — it has decreased by 2.70% in the past 24 hours.
Depending on the exchange, the stock ticker may vary. For instance, on SWB exchange APERAM S.A. SHARES stocks are traded under the ticker 7AAN.
APERAM S.A. SHARES is going to release the next earnings report on May 3, 2024. Keep track of upcoming events with our Earnings Calendar.
One year price forecast for APERAM S.A. SHARES has a max estimate of 42.95 EUR and a min estimate of 26.55 EUR.
7AAN earnings for the last quarter are −0.60 EUR whereas the estimation was −0.09 EUR which accounts for −573.50% surprise. Estimated earnings for the next quarter are −0.04 EUR. See more details about APERAM S.A. SHARES earnings.
APERAM S.A. SHARES revenue for the last quarter amounts to 1.54 B EUR despite the estimated figure of 1.47 B EUR. In the next quarter revenue is expected to reach 1.54 B EUR.
Yes, you can track APERAM S.A. SHARES financials in yearly and quarterly reports right on TradingView.
Like other stocks, 7AAN shares are traded on stock exchanges, e.g. Nasdaq, Nyse, Euronext, and the easiest way to buy them is through an online stock broker. To do this, you need to open an account and follow a broker's procedures, then start trading. You can trade APERAM S.A. SHARES stock right from TradingView charts — choose your broker and connect to your account.
As of Apr 16, 2024, the company has 11.50 K employees. See our rating of the largest employees — is APERAM S.A. SHARES on this list?
EBITDA measures a company's operating performance, its growth signifies an improvement in the efficiency of a company. APERAM S.A. SHARES EBITDA is 297.33 M EUR, and current EBITDA margin is 3.70%. See more stats in APERAM S.A. SHARES financial statements.