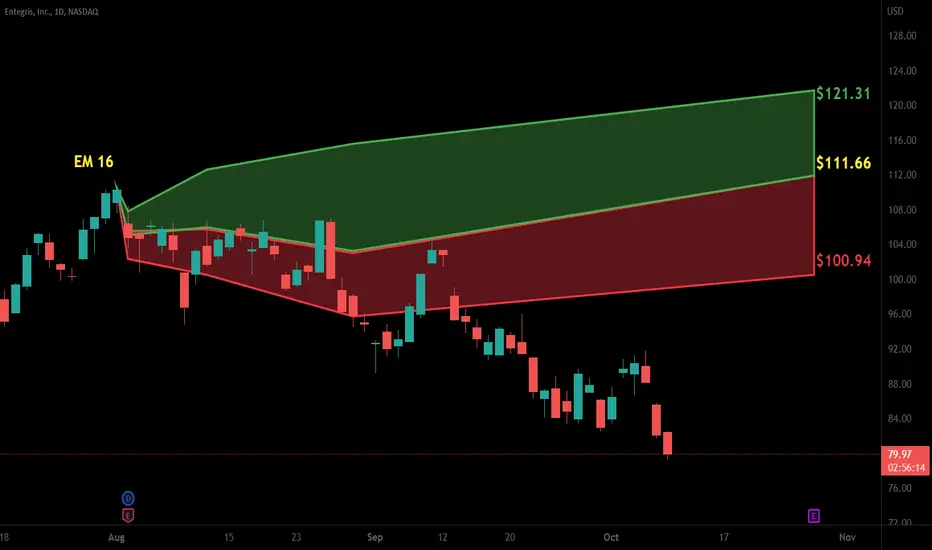
LONG ENTG 042224I like longing Entegris here, we are fast approaching the ERL but within the IRL range and as such I am looking to take a long here to target 131 at the big gapper from February 8th.
First week may provide some boosts with earnings tailwinds but some selling may carry at open. If the first three di
1.10EUR
163.69 MEUR
3.19 BEUR
149.73 M
About ENTERGRIS INC.
Sector
Industry
CEO
Bertrand Loy
Website
Headquarters
Billerica
Employees (FY)
8 K
Founded
1966
FIGI
BBG000CNY043
Entegris, Inc. engages in the development, manufacture, and supply of specialty materials for the microelectronics industry. It operates through the following segments: Materials Solutions (MS), Microcontamination Control (MC), and Advanced Materials Handling (AMH). The MS segment provides materials-based solutions, such as chemical mechanical planarization slurries and pads, deposition materials, process chemistries and gases, formulated cleans, etchants, and other specialty materials. The MC segment offers advanced solutions that improve customers’ yield, device reliability, and cost by filtering and purifying critical liquid chemistries and gases used in semiconductor manufacturing processes and other high-technology industries. The AMH segment develops solutions that improve customers’ yields by protecting critical materials during manufacturing, transportation, and storage, including products that monitor, protect, transport and deliver critical liquid chemistries, wafers, and other substrates for a broad set of applications in the semiconductor, life sciences, and other high-technology industries. The company was founded in 1966 and is headquartered in Billerica, MA.

ENTGEntegris, Inc. is an American provider of products and systems that purify, protect, and transport critical materials used in the semiconductor device fabrication process. Entegris operates out of its headquarters in Billerica, Massachusetts.
Potential buy/long.

Bullish Alert on ENTGBullish alert and the price already broken the solid base created during the last week.

ENTG Bull Flag BreakoutLooking to buy the retest here of the bull flag and take profit at the 1.618 fib. May retest the blue trendline in the future. If it does ill buy there as well.

ENTG prepping for move...ENTG with a nice bounce off support from yesterday's low. Good triangle formation here and with FOMC tomorrow as a catalyst expecting a breakout move.

ENTG, Resumption of down trend.ENTG was strongly rejected from strong resistance shown on the chart !.
It more than likely has completed wave B of an ABC form of correction which means next down going wave ( Wave C) has been started.
Fibonacci levels and broken down trend line which now acts as resistance have been shown on

$ENTG with a Bullish outlook following its earnings #Stocks The PEAD projected a Bullish outlook for $ENTG after a Negative Under reaction following its earnings release placing the stock in drift D with an expected accuracy of 50%.
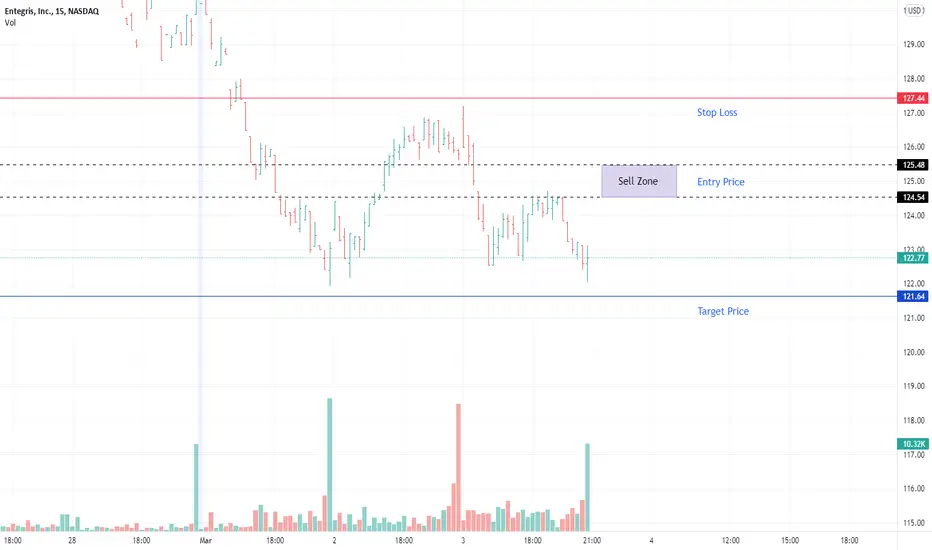
4/3/2022 NASDAQ (ENTG)Short (Entry Price) within the sell zone area and exit (Stop Loss) above the red line. Can take profit at the suggested Target Price.
Entry Price: $125.48 /$124.54
Target Price: $123.52 / $121.64
Stop Loss: $127.44
Did ENTG Just find support?I originally found this stock through a FINVIZ screener. It has awesome Fundamentals And Technical for a buy. But we defintly need to wait for conformation to buy, unless your risky. Earnings is coming in 2 days from now and if the market reacts positively I'd say its definitely time to enter a long

Long ENTGEntegris indicates a good range bound buffalo pattern. Appears to have EPS avg of 30% over the last 5 years and forecast of 16% in the next Y.
Stop Loss = 127

See all ideas
Trade directly on the supercharts through our supported, fully-verified and user-reviewed brokers.


Frequently Asked Questions
The current price of ENQ is 115.16 EUR — it has increased by 0.02% in the past 24 hours.
Depending on the exchange, the stock ticker may vary. For instance, on SWB exchange ENTERGRIS INC. stocks are traded under the ticker ENQ.
ENTERGRIS INC. is going to release the next earnings report on May 1, 2024. Keep track of upcoming events with our Earnings Calendar.
ENQ stock is 0.02% volatile and has beta coefficient of 1.59. Check out the list of the most volatile stocks — is ENTERGRIS INC. there?
One year price forecast for ENTERGRIS INC. has a max estimate of 151.02 EUR and a min estimate of 119.72 EUR.
ENQ earnings for the last quarter are 0.64 EUR per share, whereas the estimation was 0.57 EUR resulting in a 12.50% surprise. The estimated earnings for the next quarter are 0.53 EUR per share. See more details about ENTERGRIS INC. earnings.
ENTERGRIS INC. revenue for the last quarter amounts to 840.27 M EUR despite the estimated figure of 842.98 M EUR. In the next quarter revenue is expected to reach 707.55 M EUR.
Yes, you can track ENTERGRIS INC. financials in yearly and quarterly reports right on TradingView.
ENQ stock has fallen by 6.08% compared to the previous week, the month change is a 9.75% fall, over the last year ENTERGRIS INC. has showed a 75.82% increase.
ENQ net income for the last quarter is 34.41 M EUR, while the quarter before that showed 31.42 M EUR of net income which accounts for 9.51% change. Track more ENTERGRIS INC. financial stats to get the full picture.
Today ENTERGRIS INC. has the market capitalization of 17.30 B, it has decreased by 4.39% over the last week.
Yes, ENQ dividends are paid quarterly. The last dividend per share was 0.09 EUR. As of today, Dividend Yield (TTM)% is 0.33%. Tracking ENTERGRIS INC. dividends might help you take more informed decisions.
ENTERGRIS INC. dividend yield was 0.33% in 2023, and payout ratio reached 33.42%. The year before the numbers were 0.61% and 27.41% correspondingly. See high-dividend stocks and find more opportunities for your portfolio.
Like other stocks, ENQ shares are traded on stock exchanges, e.g. Nasdaq, Nyse, Euronext, and the easiest way to buy them is through an online stock broker. To do this, you need to open an account and follow a broker's procedures, then start trading. You can trade ENTERGRIS INC. stock right from TradingView charts — choose your broker and connect to your account.
As of Apr 23, 2024, the company has 8.00 K employees. See our rating of the largest employees — is ENTERGRIS INC. on this list?
Investing in stocks requires a comprehensive research: you should carefully study all the available data, e.g. company's financials, related news, and its technical analysis. So ENTERGRIS INC. technincal analysis shows the neutral today, and its 1 week rating is neutral. Since market conditions are prone to changes, it's worth looking a bit further into the future — according to the 1 month rating ENTERGRIS INC. stock shows the buy signal. See more of ENTERGRIS INC. technicals for a more comprehensive analysis.
If you're still not sure, try looking for inspiration in our curated watchlists.
If you're still not sure, try looking for inspiration in our curated watchlists.
We've gathered analysts' opinions on ENTERGRIS INC. future price: according to them, ENQ price has a max estimate of 151.02 EUR and a min estimate of 119.71 EUR. Read a more detailed ENTERGRIS INC. forecast: see what analysts think of ENTERGRIS INC. and suggest that you do with its stocks.
EBITDA measures a company's operating performance, its growth signifies an improvement in the efficiency of a company. ENTERGRIS INC. EBITDA is 670.22 M EUR, and current EBITDA margin is 22.42%. See more stats in ENTERGRIS INC. financial statements.