GWW LONG 041824For those who get it done,
The recent downtrend may be a result of erosion in other hardware manufacturers or simply profit taking but I don't see Grainger going anywhere. This is a great gap of liquidity that was waiting to go long and I will be seeing a bounce in the next week.
From what I under
33.2EUR
1.66 BEUR
14.93 BEUR
44.54 M
About W.W. GRAINGER INC.
Sector
Industry
CEO
Donald G. Macpherson
Website
Headquarters
Lake Forest
Employees (FY)
26 K
Founded
1928
ISIN
US3848021040
FIGI
BBG000GXZDT1
W.W. Grainger, Inc. is a distributor of maintenance, repair, and operating products and services with operations in North America, Japan, and the United Kingdom. It operates through the following segments: High-Touch Solutions North America, Endless Assortment, and Other. The High-Touch Solutions North America segment includes value-added MRO solutions that are rooted in deep product knowledge and customer expertise. The Endless Assortment segment provides a streamlined and transparent online platform with one-stop shopping for millions of products. The Other segment refers to the company's Cromwell business in the U.K. and a wholly owned captive insurance entity. The company was founded by William Wallace Grainger in 1928 and is headquartered in Lake Forest, IL.

$GWW with a bullish outlook following its earnings #StocksThe PEAD projected a bullish outlook for $GWW after a positive under reaction following its earnings release placing the stock in drift A with an expected accuracy of 100%.

Exhausted trend?Cooked W before the descent Down,
This has been a long and profitable trend up. Should you let go>???
Some would ride it looking for new high. Some would not
Others may admit the trend has gray hair by now!
Always Be safe and never lose your shadow.
Has met T1.
N recommendation

$GWW with a Bullish outlook following its earnings #Stocks The PEAD projected a Bullish outlook for $GWW after a Positive Under reaction following its earnings release placing the stock in drift A with an expected accuracy of 100%.

Controversial Trade Idea: $GWW sells metal detectorsI'll do my best to leave the politics out of this.
Mass shootings are in the spotlight again, and it would be obvious in hindsight to see a boost in demand and sales for security systems such as metal detectors.
NYSE:GWW , who just teamed up with The Mom Project, had $13 billion in sales in 202

$GWW with a Bullish outlook following its earnings #Stocks The PEAD projected a Bullish outlook for $GWW after a Positive over reaction following its earnings release placing the stock in drift B with an expected accuracy of 83.33%.

$GWW right below ATHs$GWW back on my secondary watch list after selling this for profit earlier.
Sitting right below ATHs supply line.
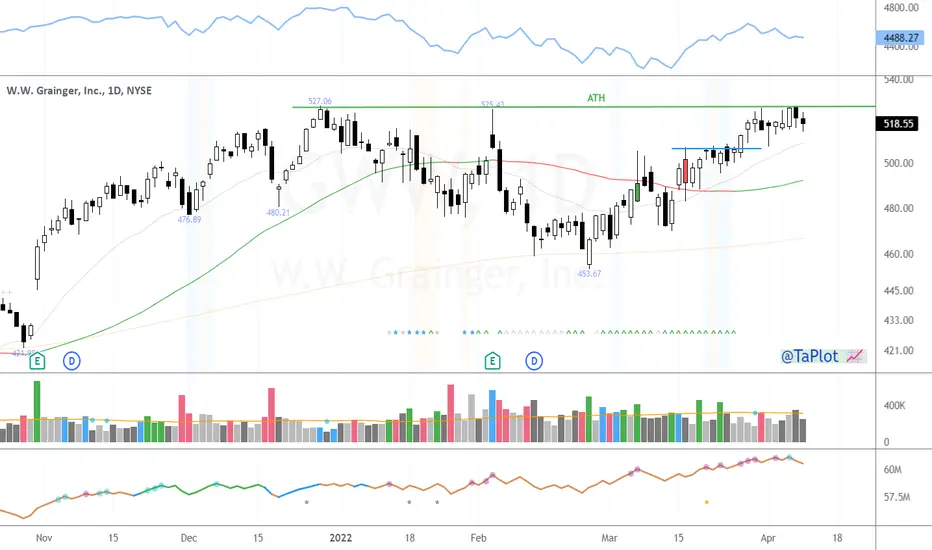
$GWW pulling back from ATHsI also sold $GWW almost at the high on Thursday when it tested its previous ATHs.
Volume pattern still looks strong. One to keep an eye on how it unfolds in coming days.

$GWW Cup Completion Cheat Setup$GWW setting up with a potential cup completion cheat (3 Cs) with a nice tight pivot to anchor risk around.

Potential 2Down 2Up Weekly Reversal For GWW Potential 2Down 2Up Weekly Reversal For GWW : Per the Strat, this week I'm watching ticker GWW (W.W. Grainger Inc) for a weekly entry trigger at 406.74 (last weeks high). If that trigger is met, I'll look for it to reach a magnitude of 417.79 (week before last weeks high). If it can reach magnitude,

See all ideas
Trade directly on the supercharts through our supported, fully-verified and user-reviewed brokers.


Frequently Asked Questions
Depending on the exchange, the stock ticker may vary. For instance, on SWB exchange W.W. GRAINGER INC. stocks are traded under the ticker GWW.
W.W. GRAINGER INC. is going to release the next earnings report on Apr 25, 2024. Keep track of upcoming events with our Earnings Calendar.
One year price forecast for W.W. GRAINGER INC. has a max estimate of 1057.1 EUR and a min estimate of 845.6 EUR.
GWW earnings for the last quarter are 8.92 EUR per share, whereas the estimation was 8.44 EUR resulting in a 5.66% surprise. The estimated earnings for the next quarter are 7.29 EUR per share. See more details about W.W. GRAINGER INC. earnings.
W.W. GRAINGER INC. revenue for the last quarter amounts to 3.98 B EUR despite the estimated figure of 3.99 B EUR. In the next quarter revenue is expected to reach 3.66 B EUR.
Yes, you can track W.W. GRAINGER INC. financials in yearly and quarterly reports right on TradingView.
GWW net income for the last quarter is 357.87 M EUR, while the quarter before that showed 450.29 M EUR of net income which accounts for −20.52% change. Track more W.W. GRAINGER INC. financial stats to get the full picture.
Yes, GWW dividends are paid quarterly. The last dividend per share was 1.73 EUR. As of today, Dividend Yield (TTM)% is 0.79%. Tracking W.W. GRAINGER INC. dividends might help you take more informed decisions.
W.W. GRAINGER INC. dividend yield was 0.88% in 2023, and payout ratio reached 20.00%. The year before the numbers were 1.22% and 22.40% correspondingly. See high-dividend stocks and find more opportunities for your portfolio.
Like other stocks, GWW shares are traded on stock exchanges, e.g. Nasdaq, Nyse, Euronext, and the easiest way to buy them is through an online stock broker. To do this, you need to open an account and follow a broker's procedures, then start trading. You can trade W.W. GRAINGER INC. stock right from TradingView charts — choose your broker and connect to your account.
As of Apr 19, 2024, the company has 26.00 K employees. See our rating of the largest employees — is W.W. GRAINGER INC. on this list?
We've gathered analysts' opinions on W.W. GRAINGER INC. future price: according to them, GWW price has a max estimate of 1057.05 EUR and a min estimate of 845.64 EUR. Read a more detailed W.W. GRAINGER INC. forecast: see what analysts think of W.W. GRAINGER INC. and suggest that you do with its stocks.
EBITDA measures a company's operating performance, its growth signifies an improvement in the efficiency of a company. W.W. GRAINGER INC. EBITDA is 2.55 B EUR, and current EBITDA margin is 17.02%. See more stats in W.W. GRAINGER INC. financial statements.