THETAUSDT – Rising Channel BreakdownTHETAUSDT has broken below the rising channel support on the 4H chart and is now trading below the trendline and moving average.
Price is currently testing the broken support area around $0.216–$0.220. If this zone acts as resistance, bearish momentum could continue toward lower support levels.
Trade Setup:
Entry: Around $0.216
Stop Loss: $0.237
Target: Around $0.169
A move back above the broken trendline could invalidate the bearish setup.
In-depth trading ideas
#THETA MACRO BOTTOM BREAKOUT – PAY CLOSE ATTENTION!🔥 #THETA MACRO BOTTOM BREAKOUT – PAY CLOSE ATTENTION! 🚀📈
MYX:THETA (Theta Network/USDT) has officially broken out of its long-term accumulation base on the 1W chart! After bouncing strongly off macro demand around $0.2013, price is pushing upward with strong momentum, confirming a clear shift from consolidation to a new bullish expansion wave.
Holding cleanly above the key horizontal pivot at $0.2013 sets up an exceptional risk-to-reward opportunity, with price trending toward major multi-mo
THETA/USDT (1h) Consolidating Inside a Descending TriangleTHETA/USDT is consolidating inside a descending triangle on the 1H chart, with price forming lower highs beneath the descending resistance while repeatedly holding a relatively flat support area around $0.222–$0.223.
Price is currently around $0.225, still trading inside the structure as it approaches the apex. A confirmed 1H breakout and hold above the descending trendline around $0.226–$0.227 could invalidate the bearish structure and open the way toward the $0.240–$0.241 measured target area.
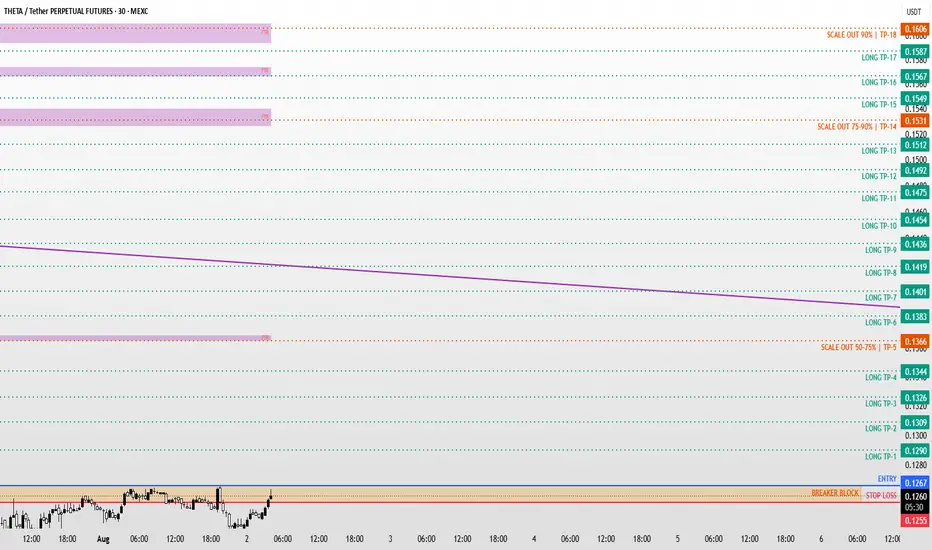
THETA / THETAUSDT Long Setup | Breaker Block ReclaimMARKET ANALYSIS
THETA is currently reacting from a key technical area highlighted on the chart.
As long as the protected support zone remains intact, the bullish market structure remains valid and higher liquidity targets may continue to attract price action.
A breakdown below the invalidation level would weaken the current bullish scenario and require a reassessment of market conditions.
📍 Entry, Stop Loss and Take Profit levels are marked directly on the chart.
━━━━━━━━━━━━━━
⚠️ DISC
THETAUSDTIn the short term crypto currencies rallied in response to the US treasury buy back program. Presently, price is in a correction where we are looking to add more longs. Price is anticipated to crater in response to the possible Fed rate hike that will push cryptos further into discount territory. Our ideal entry 🚪is the weekly sell side liquidity.
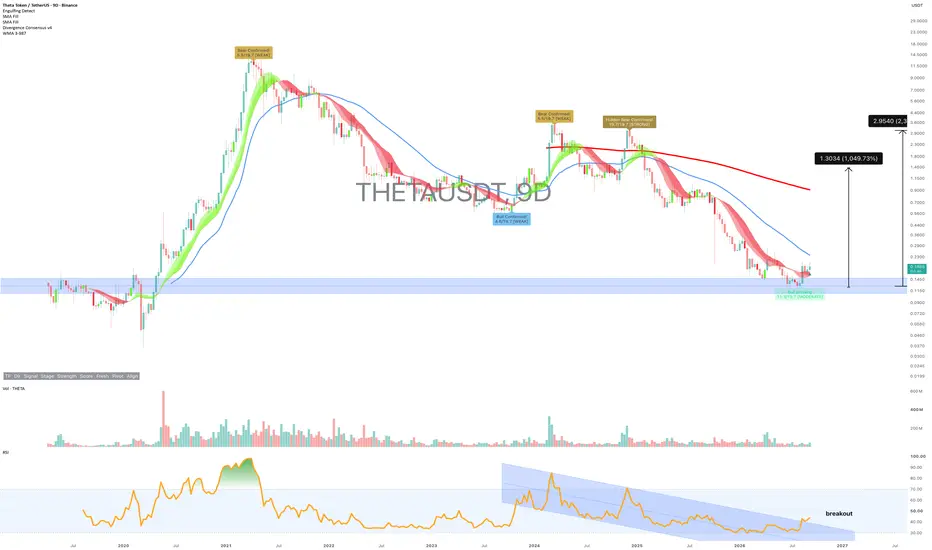
THETA: The World Is short of compute. This sells compute - Sep26SYMBOL: BINANCE:THETAUSDT | DIRECTION: LONG | TIMEFRAME: 9-Day
Published: September 2026
Amazon, Alphabet, Meta, Microsoft and Oracle will spend more than $600 billion on infrastructure in 2026. Roughly $450 billion of it on AI. That is a 62% increase on last year’s record.
And they still cannot keep up.
GPU procurement lead times run 36 to 52 weeks. North American data centre vacancy sits at a record low of 1.6%. AI data centres are consuming 70% of global memory production. The hyperscale
THETA ForecastEntry Rationale:
We have seen a very strong bullish move on BINANCE:THETAUSDT , followed by a proportional corrective move on the higher timeframe.
Although I have a bearish overall market bias for today, this particular asset could still have strong upside potential if it manages to break the trigger level decisively to the upside. Historically, when this setup confirms, I would expect a good upward move.
Many other assets are showing a similar structure on the higher timeframe as well.
Is THETA about to leave its months-long accumulation ?Yello Paradisers! THETA is showing a textbook Wyckoff accumulation structure on the daily timeframe, and the latest breakout is beginning to confirm that buyers are taking control.
💎After the initial Selling Climax around $0.134, THETA established its Automatic Rally before entering a prolonged accumulation range. The market later swept below support toward $0.121, forming the Spring and successfully reclaiming the range. This was an important sign that the breakdown lacked acceptance and selli
Theta Token Ultimate Bottom = 2,000% - 5,000% Growth Potential Good evening my fellow Cryptocurrency trader, I hope you are having a wonderful day.
Here we are looking at THETHAUSDT on the weekly timeframe with a chart structure that is many times better than great, awesome is the right word.
The lowest price in more than five years is now available after a sustained bear market. The good news is that the bottom is in. We have a repeat of the previous bear market cycle pattern and chart.
THETAUSDT went down and did its bottom through a process that so fa
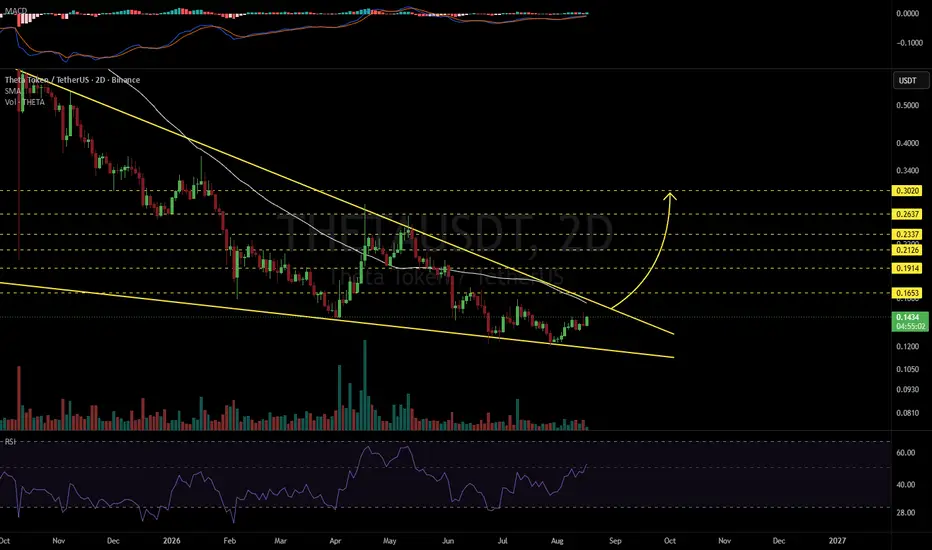
THETAUSDT 2D#THETA is trading within a falling wedge pattern on the 2-day timeframe. The structure looks promising, while both RSI and MACD are showing bullish momentum. Price is approaching the wedge resistance and the 2-day SMA50. A confirmed breakout above these key levels could trigger a bullish move toward the following upside targets:
🎯 $0.1653
🎯 $0.1914
🎯 $0.2126
🎯 $0.2337
🎯 $0.2637
🎯 $0.3020
⚠️ Always use a tight stop-loss and apply proper risk management.
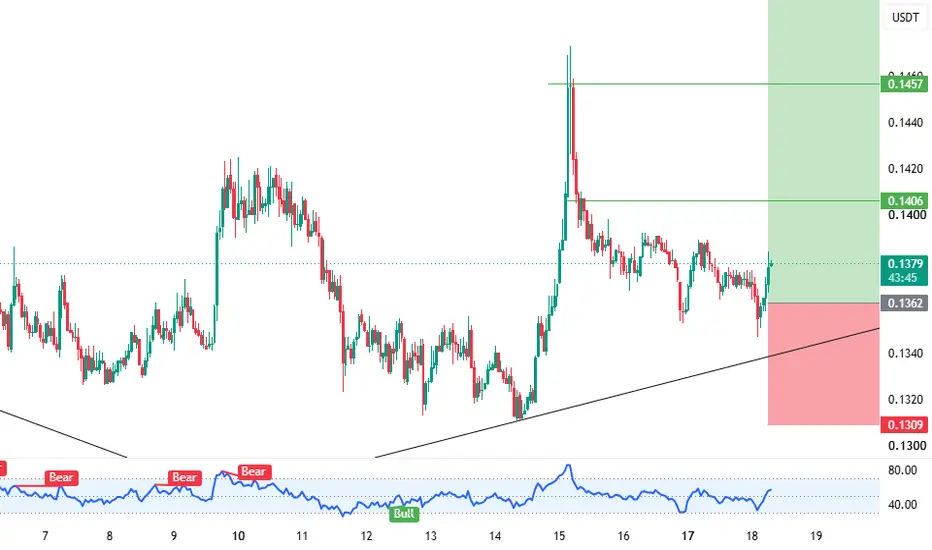
THETA USDT LONG SIGNAL61. THETA/USDT – Trade Setup (LONG)
📈 Position Type: LONG
🕒 Timeframe: 1H
📊 Market: Futures
💰 Entry Zone:
0.1362
🛑 Stop-Loss:
0.13
🎯 Take-Profit Targets:
• TP1: 0.14
• TP2: 0.1457
• TP3: 0.1511
• TP4. 0.1570
Tp5.
⚙️ Leverage:
5*
▫️ After TP1, move SL to Entry + 0.2%.
▪️ Exit Plan:
• 40% at TP1
• 20% at TP2
• 20% at TP3
20% at TP4
📌 Risk Management:
Risk only 1–2% of your capital per trade.
⚠️ Always check and confirm the setup on your chart before entering the trade.
THETA Preparing for Major Move — Bullish Breakout or Rejection?📊 Technical Analysis
💵 Coin: MYX:THETA / USDT
⏳ Time Frame: 2D
📐 Pattern: Descending Trendline / Bearish Downtrend
📍 Current Price: ~0.1384 USDT
🔎 Market Structure
THETA/USDT remains in a clear long-term bearish structure, characterized by a sequence of lower highs and lower lows.
The yellow Descending Trendline has acted as dynamic resistance since the major high around the 0.90 area. Price has repeatedly struggled to reclaim this trendline, indicating that sellers remain active on major
THETA / THETAUSDT Long Setup | Breaker Block ReclaimMARKET ANALYSIS
THETA / THETA NETWORK is currently reacting from a key technical area highlighted on the chart.
As long as the protected support zone remains intact, the bullish market structure remains valid and higher liquidity targets may continue to attract price action.
A breakdown below the invalidation level would weaken the current bullish scenario and require a reassessment of market conditions.
📍 Entry, Stop Loss and Take Profit levels are marked directly on the chart.
━━━━━━━
THETA / THETAUSDT Long Setup | Breaker Block ReclaimMARKET ANALYSIS
THETA is currently reacting from a key technical area highlighted on the chart.
As long as the protected support zone remains intact, the bullish market structure remains valid and higher liquidity targets may continue to attract price action.
A breakdown below the invalidation level would weaken the current bullish scenario and require a reassessment of market conditions.
📍 Entry, Stop Loss and Take Profit levels are marked directly on the chart.
━━━━━━━━━━━━━━
⚠️ DISC
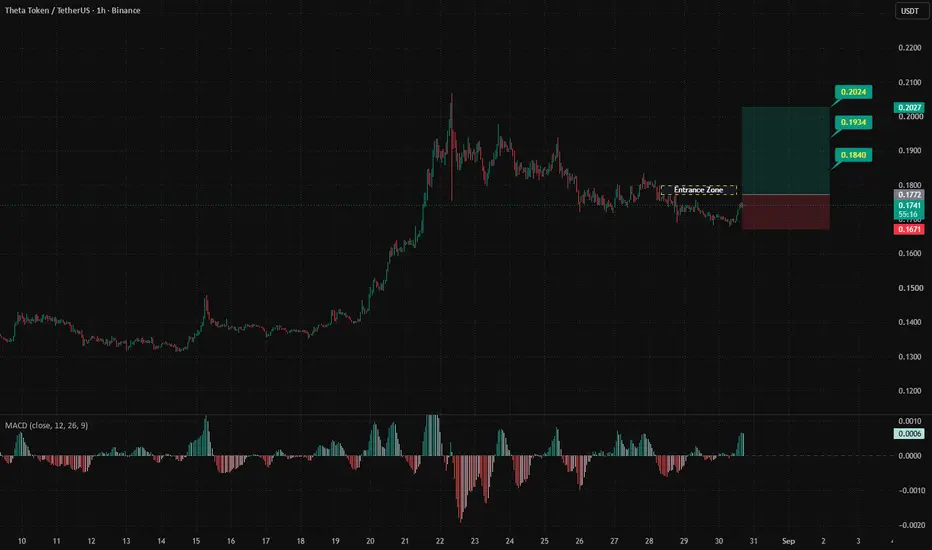
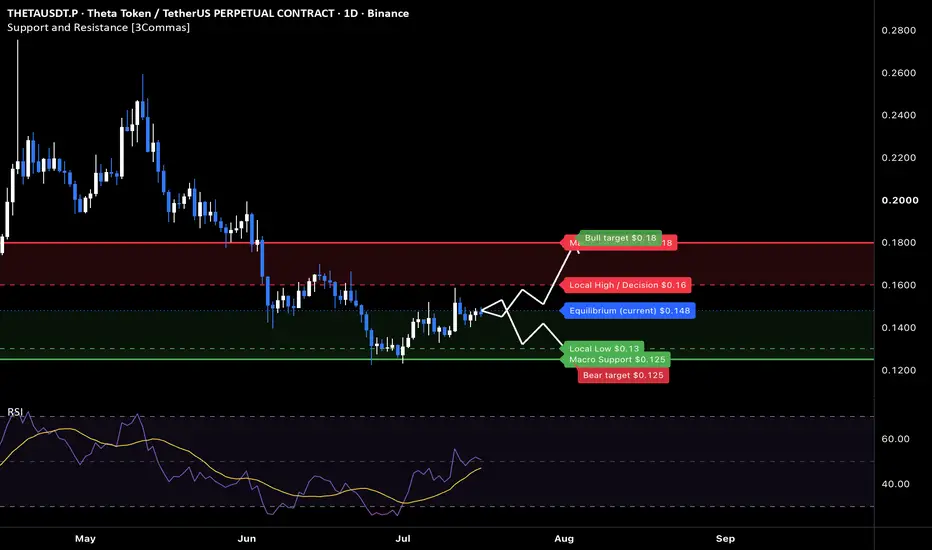
THETA at macro floor: base recovery toward $0.18The Macro Picture 🗺️
THETA flushed from the $0.24–0.26 highs down into the $0.125 macro floor, then stopped bleeding. Price is now grinding sideways just above support, with RSI curling back up through 50 — the classic sign that sellers are exhausted and a base is forming.
The Setup ⚙️
The Accumulation Zone 🟢
$0.125–0.13 is where the selling dried up. Every push lower got bought back. This is the demand shelf the recovery is building from.
The Decision Point 🔴
$0.16 (Local High) is the first
THETA will crash 95%+ and provide an EXCELLENT entry SUB $1THETA's goose is about to be cooked in tandem with Bitcoin retracing back to AT LEAST 20K area. Could THETA have one last surge? - yes of course, but with Bitcoin cliff-walking and Ethereum going parabolic it looks like this chapter of the show will be over soon enough. THETA has been a big hitter but what goes up must come down and price is looking corrective. Target for entry is currently sub $1.
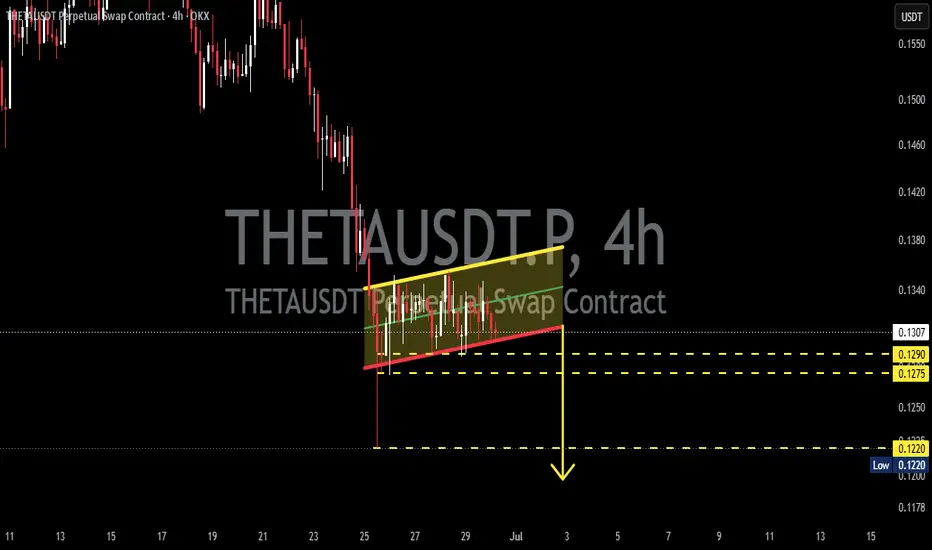
THETAUSDT - Bear Flag, Potential Continuation of the Downtrend?On the 4H timeframe, THETAUSDT Perpetual remains in a well-defined downtrend. 📉 After experiencing a sharp decline (Flagpole), the price is now moving in a consolidation phase, forming a classic 🐻 Bear Flag pattern.
📚 The Bear Flag is a bearish continuation pattern that typically develops after a strong sell-off. The current consolidation within a slightly upward-sloping channel suggests that buying pressure is gradually weakening, while sellers continue to dominate the market. ⚖️
🔻 As long as
THETA Holding Key Demand ZoneTheta Token (THETA/USDT) is currently approaching a well-defined demand zone around 0.2040 – 0.2100, which has been acting as short-term support.
The broader structure shows a descending trendline with price compressing toward the support zone, indicating a potential accumulation phase. Multiple rejections from this region suggest buyers are defending this level.
Key Observations:
Strong horizontal support in the 0.2040 – 0.2100 region
Descending trendline indicating compression
RSI near lower
Theta | 4hr Chart | April 2026** T.A explained **
Basics:
Ranges = two or more consecutive color candles.
There are two types of ranges - accumulation and distribution.
A single candle is a range on a lower timeframe. We only look at the first and last candle in each range.
DISTRIBUTION RANGES DEFINED: BackSide (BS) Candle - First distribution candle in a distribution range. Expectation = strong reaction to price. long wicks reaching to or away from level.
FrontSide (FS) Candle - Last distribution candle in a distribution r
THETAUSDT 1D#THETA is trading within a falling wedge pattern on the daily chart and is currently holding the daily SMA50. Consider accumulating a small position at current levels and near support zones. In case of a confirmed breakout above the wedge resistance and the Ichimoku Cloud, the potential targets are:
🎯 $0.196
🎯 $0.229
🎯 $0.256
🎯 $0.283
🎯 $0.321
🎯 $0.370
⚠️ Always remember to use a tight stop-loss and maintain proper risk management.