FTSE100 post-Budget rally: Inverse Head & Shoulders eyes 9800Chancellor Reeves unveiled tax rises worth £26 billion annually by 2029-30 but showed fiscal discipline by committing to reduce government spending as a share of GDP each year and more than doubling the fiscal headroom buffer to £21.7 billion, reassuring bond markets still scarred by the Liz Truss mini-budget crisis.
With gilt yields falling, sterling at its best level since October, and a Bank of England rate cut expected in December, the macro backdrop supports further upside for Footsie, though sticky inflation and OBR growth downgrades remain headwinds.
Key drivers:
UK Budget introduces tax rises totalling £26bn annually by 2029-30 via threshold freezes, mansion tax, and dividend levies, but spending will decline as a share of GDP each year, calming government borrowing concerns and sending gilt yields lower.
Fiscal headroom buffer more than doubled to £21.7bn (from £9.9bn last year), giving bond vigilantes confidence that the debt trajectory is sustainable.
Sterling rallied above 1.32 towards 1.33 on lower borrowing risks, while FTSE 100 gained, led by financials.
Bank of England expected to cut rates 25bp in December, supporting equities, though sticky inflation and OBR growth downgrades are headwinds.
Technical setup : inverse head and shoulders with neckline/support at 9,630 (38.2% Fib), measured move and Fib confluence target 9,800 (between 61.8% and 78.6% retracement).
Trade idea : Entry on pullback to 38.2% Fib (9,630), stop below previous low (9,434), target 9,800, for 2:1+ risk-to-reward.
Trading the FTSE bounce? Drop your setups in the comments and follow for more high-action technical and macro trade ideas.
This content is not directed to residents of the EU or UK. Any opinions, news, research, analyses, prices or other information contained on this website is provided as general market commentary and does not constitute investment advice. ThinkMarkets will not accept liability for any loss or damage including, without limitation, to any loss of profit which may arise directly or indirectly from use of or reliance on such information.
Trade ideas

FTSE bullish breakout supported at 9655The FTSE remains in a bullish trend, with recent price action showing signs of a breakout within the broader uptrend.
Support Zone: 9655 – a key level from previous consolidation. Price is currently testing or approaching this level.
A bullish rebound from 9655 would confirm ongoing upside momentum, with potential targets at:
9765 – initial resistance
9800 – psychological and structural level
9885 – extended resistance on the longer-term chart
Bearish Scenario:
A confirmed break and daily close below 9655 would weaken the bullish outlook and suggest deeper downside risk toward:
9625 – minor support
9595 – stronger support and potential demand zone
Outlook:
Bullish bias remains intact while the FTSE holds above 9655. A sustained break below this level could shift momentum to the downside in the short term.
This communication is for informational purposes only and should not be viewed as any form of recommendation as to a particular course of action or as investment advice. It is not intended as an offer or solicitation for the purchase or sale of any financial instrument or as an official confirmation of any transaction. Opinions, estimates and assumptions expressed herein are made as of the date of this communication and are subject to change without notice. This communication has been prepared based upon information, including market prices, data and other information, believed to be reliable; however, Trade Nation does not warrant its completeness or accuracy. All market prices and market data contained in or attached to this communication are indicative and subject to change without notice.

UK 100 Index – Psychological 10000 level Within Sight!As the dust settles on the UK Chancellor’s Autumn budget that was released on Wednesday it’s potentially a good time to assess the current backdrop for the UK 100 moving into early December.
First things first, Wednesday’s budget didn’t lead to an immediate rush to sell UK assets, which most notably was the case in the Liz Truss era and was a possible concern in the lead up to this release. Government bond markets took the series of tax rises and spending announcements in their stride, GBPUSD squeezed out some weak shorts to post a high of 1.3268 on Thursday, and the UK 100 followed it to print a 2 week high of 9715 before running into some profit taking on a move which had seen it rally from a low of 9425 posted on November 21st.
Looking forward, the focus for 100 UK traders may now shift to the interest rate decisions of the Federal Reserve (Fed) on December 10th and the Bank of England (BoE) on December 18th. The Fed rate decision could be important for two reasons, the first is that it may dictate the path of general risk sentiment into year end and secondly, with the UK 100 index dominated by multi-national companies generating around 70% of their revenue outside of the UK, any Fed move could directly impact their earnings outlook for early next year.
In terms of the BoE, while the Autumn budget wasn’t perhaps perceived by economists to be as dis-inflationary as it could have been, it may have done enough to shift the voting at the December meeting towards another 25bps (0.25%) cut. Certainly, the market thinks this to be the case with around 90% chance of a cut currently priced, although there could still room for a surprise ‘no change’ or disappointment on the speed of future rate cuts to start 2026.
While UK 100 price volatility may have reduced over this US Thanksgiving holiday period into the end of November, it could be very different story during the first 3 weeks of December.
Technical Outlook: How Much Further Can the Current Rally Go?
Since posting the 9425 November 21st low, the UK 100 index has rallied just over 3%, with immediate resistance levels giving way. This now includes closes above 9692, a level equal to the Bollinger mid‑average.
Traders may see this as the start of a further phase of price strength, but it remains essential to monitor both immediate support and resistance levels to gauge the next directional themes.
While a close above mid‑average resistance at 9692 could be interpreted as a signal of further upside potential ahead, there is no guarantee of this, and near‑term support levels may prove just as important in shaping price action over the coming days.
Potential Resistance Levels:
After the close above the Bollinger mid-average resistance at 9492 the focus could now be on 9742 as the next resistance. This level is equal to the 61.8% Fibonacci retracement
A successful close above 9742 is required to suggest further attempts at price strength, which could then shift focus towards potential tests of 9940, the November 12th all-time high.
Potential Support Levels:
After the latest price strength, initial support may now stand at 9605, the 38.2% retracement of the November rally. While a pattern of higher highs and higher lows is still intact, closing breaks below 9605 could lead toward further short-term weakness.
If the 9605 retracement gives way on a closing basis, risks could then shift toward deeper declines, opening scope for tests of 9537, which is the 61.8% retracement, possibly even 9425, the November 21st session low.
The material provided here has not been prepared accordance with legal requirements designed to promote the independence of investment research and as such is considered to be a marketing communication. Whilst it is not subject to any prohibition on dealing ahead of the dissemination of investment research, we will not seek to take any advantage before providing it to our clients.
Pepperstone doesn’t represent that the material provided here is accurate, current or complete, and therefore shouldn’t be relied upon as such. The information, whether from a third party or not, isn’t to be considered as a recommendation; or an offer to buy or sell; or the solicitation of an offer to buy or sell any security, financial product or instrument; or to participate in any particular trading strategy. It does not take into account readers’ financial situation or investment objectives. We advise any readers of this content to seek their own advice. Without the approval of Pepperstone, reproduction or redistribution of this information isn’t permitted.

FTSE 100 index UK Beware BuyersFTSE 100 index UK Beware Buyers
i am expecting price fall little lower.
Sellside liqudity sitiing below.
wait for tab in point of intrest .
start sweeping high,s and running low,s.
i will open my short position.
best of luck


FTSE UK100 Daily Trade SetupsIn this update we review the recent price action in the FTSE UK100 and identify the next high-probability trade opportunity and price objectives to target. To review today's video analysis clcik here!

FTSE higher - UK Budget in focusThe FTSE remains in a bullish trend, with recent price action showing signs of a breakout within the broader uptrend.
Support Zone: 9510 – a key level from previous consolidation. Price is currently testing or approaching this level.
A bullish rebound from 9510 would confirm ongoing upside momentum, with potential targets at:
9715 – initial resistance
9760 – psychological and structural level
9800 – extended resistance on the longer-term chart
Bearish Scenario:
A confirmed break and daily close below 9510 would weaken the bullish outlook and suggest deeper downside risk toward:
9477 – minor support
9430 – stronger support and potential demand zone
Outlook:
Bullish bias remains intact while the FTSE holds above 9510. A sustained break below this level could shift momentum to the downside in the short term.
This communication is for informational purposes only and should not be viewed as any form of recommendation as to a particular course of action or as investment advice. It is not intended as an offer or solicitation for the purchase or sale of any financial instrument or as an official confirmation of any transaction. Opinions, estimates and assumptions expressed herein are made as of the date of this communication and are subject to change without notice. This communication has been prepared based upon information, including market prices, data and other information, believed to be reliable; however, Trade Nation does not warrant its completeness or accuracy. All market prices and market data contained in or attached to this communication are indicative and subject to change without notice.

FTSE This chart shows a clear change.
The upside swing has lost the 90 degree angle.
The bearish swing was volatile.
The bullish swing was, until it wasnt.
Clear 4hr change in delivery.
Momentum lost .


FTSE sideways consolidation below 9765 resistanceThe FTSE remains in a bullish trend, with recent price action showing signs of a breakout within the broader uptrend.
Support Zone: 9655 – a key level from previous consolidation. Price is currently testing or approaching this level.
A bullish rebound from 9655 would confirm ongoing upside momentum, with potential targets at:
9765 – initial resistance
9800 – psychological and structural level
9885 – extended resistance on the longer-term chart
Bearish Scenario:
A confirmed break and daily close below 9655 would weaken the bullish outlook and suggest deeper downside risk toward:
9625 – minor support
9595 – stronger support and potential demand zone
Outlook:
Bullish bias remains intact while the FTSE holds above 9655. A sustained break below this level could shift momentum to the downside in the short term.
This communication is for informational purposes only and should not be viewed as any form of recommendation as to a particular course of action or as investment advice. It is not intended as an offer or solicitation for the purchase or sale of any financial instrument or as an official confirmation of any transaction. Opinions, estimates and assumptions expressed herein are made as of the date of this communication and are subject to change without notice. This communication has been prepared based upon information, including market prices, data and other information, believed to be reliable; however, Trade Nation does not warrant its completeness or accuracy. All market prices and market data contained in or attached to this communication are indicative and subject to change without notice.

FTSE100 uptrend continuation supported at 9655The FTSE remains in a bullish trend, with recent price action showing signs of a breakout within the broader uptrend.
Support Zone: 9655 – a key level from previous consolidation. Price is currently testing or approaching this level.
A bullish rebound from 9655 would confirm ongoing upside momentum, with potential targets at:
9765 – initial resistance
9800 – psychological and structural level
9885 – extended resistance on the longer-term chart
Bearish Scenario:
A confirmed break and daily close below 9655 would weaken the bullish outlook and suggest deeper downside risk toward:
9625 – minor support
9595 – stronger support and potential demand zone
Outlook:
Bullish bias remains intact while the FTSE holds above 9655. A sustained break below this level could shift momentum to the downside in the short term.
This communication is for informational purposes only and should not be viewed as any form of recommendation as to a particular course of action or as investment advice. It is not intended as an offer or solicitation for the purchase or sale of any financial instrument or as an official confirmation of any transaction. Opinions, estimates and assumptions expressed herein are made as of the date of this communication and are subject to change without notice. This communication has been prepared based upon information, including market prices, data and other information, believed to be reliable; however, Trade Nation does not warrant its completeness or accuracy. All market prices and market data contained in or attached to this communication are indicative and subject to change without notice.

FTSE resistance retest at 9715The FTSE remains in a bullish trend, with recent price action showing signs of a breakout within the broader uptrend.
Support Zone: 9510 – a key level from previous consolidation. Price is currently testing or approaching this level.
A bullish rebound from 9510 would confirm ongoing upside momentum, with potential targets at:
9715 – initial resistance
9760 – psychological and structural level
9800 – extended resistance on the longer-term chart
Bearish Scenario:
A confirmed break and daily close below 9510 would weaken the bullish outlook and suggest deeper downside risk toward:
9477 – minor support
9430 – stronger support and potential demand zone
Outlook:
Bullish bias remains intact while the FTSE holds above 9510. A sustained break below this level could shift momentum to the downside in the short term.
This communication is for informational purposes only and should not be viewed as any form of recommendation as to a particular course of action or as investment advice. It is not intended as an offer or solicitation for the purchase or sale of any financial instrument or as an official confirmation of any transaction. Opinions, estimates and assumptions expressed herein are made as of the date of this communication and are subject to change without notice. This communication has been prepared based upon information, including market prices, data and other information, believed to be reliable; however, Trade Nation does not warrant its completeness or accuracy. All market prices and market data contained in or attached to this communication are indicative and subject to change without notice.

UK100 H4 | Bearish Continuation SetupMomentum: Bearish
The price has rejected off the sell entry, which is slightly below the 38.2% Fibonacci retracement.
Sell entry: 9,593.59
Strong overlap resistance
Stop loss: 9,663.89
Pullback resistance
Slightly below the 50% Fibonacci retracement
Take profit: 9,455.33
Pullback support
High Risk Investment Warning
Stratos Markets Limited (tradu.com ), Stratos Europe Ltd (tradu.com ):
CFDs are complex instruments and come with a high risk of losing money rapidly due to leverage. 70% of retail investor accounts lose money when trading CFDs with this provider. You should consider whether you understand how CFDs work and whether you can afford to take the high risk of losing your money.
Stratos Global LLC (tradu.com ): Losses can exceed deposits.
Please be advised that the information presented on TradingView is provided to Tradu (‘Company’, ‘we’) by a third-party provider (‘TFA Global Pte Ltd’). Please be reminded that you are solely responsible for the trading decisions on your account. Any information and/or content is intended entirely for research, educational and informational purposes only and does not constitute investment or consultation advice or investment strategy. The information is not tailored to the investment needs of any specific person and therefore does not involve a consideration of any of the investment objectives, financial situation or needs of any viewer that may receive it. Past performance is not a reliable indicator of future results. Actual results may differ materially from those anticipated in forward-looking or past performance statements. We assume no liability as to the accuracy or completeness of any of the information and/or content provided herein and the Company cannot be held responsible for any omission, mistake nor for any loss or damage including without limitation to any loss of profit which may arise from reliance on any information supplied by TFA Global Pte Ltd.

FTSE oversold bounce resistance at 9620The FTSE remains in a bullish trend, with recent price action showing signs of a corrective pullback within the broader uptrend.
Support Zone: 9420 – a key level from previous consolidation. Price is currently testing or approaching this level.
A bullish rebound from 9420 would confirm ongoing upside momentum, with potential targets at:
9620 – initial resistance
9690 – psychological and structural level
9745 – extended resistance on the longer-term chart
Bearish Scenario:
A confirmed break and daily close below 9420 would weaken the bullish outlook and suggest deeper downside risk toward:
9380 – minor support
9310 – stronger support and potential demand zone
Outlook:
Bullish bias remains intact while the FTSE holds above 9420. A sustained break below this level could shift momentum to the downside in the short term.
This communication is for informational purposes only and should not be viewed as any form of recommendation as to a particular course of action or as investment advice. It is not intended as an offer or solicitation for the purchase or sale of any financial instrument or as an official confirmation of any transaction. Opinions, estimates and assumptions expressed herein are made as of the date of this communication and are subject to change without notice. This communication has been prepared based upon information, including market prices, data and other information, believed to be reliable; however, Trade Nation does not warrant its completeness or accuracy. All market prices and market data contained in or attached to this communication are indicative and subject to change without notice.

You Not Mess This [weekly analysis Nov. 24-28th 2025]Get ready for a deep dive into the key market moves, upcoming catalysts, and trade ideas you can’t afford to miss. In this week’s edition we’ll cover:
EURUSD BTc S&P500 AUDNZD AUDNZD GBPCAD
AMZN MSFT FTSE
🔔 Don’t forget to subscribe and hit the bell so you never miss a weekly breakdown.
📣 Share your thoughts in the comments: What are you bullish/concerned about this week? What setups are you watching?


FTSE100 retest if important support at 9420The FTSE remains in a bullish trend, with recent price action showing signs of a corrective pullback within the broader uptrend.
Support Zone: 9420 – a key level from previous consolidation. Price is currently testing or approaching this level.
A bullish rebound from 9420 would confirm ongoing upside momentum, with potential targets at:
9620 – initial resistance
9690 – psychological and structural level
9745 – extended resistance on the longer-term chart
Bearish Scenario:
A confirmed break and daily close below 9420 would weaken the bullish outlook and suggest deeper downside risk toward:
9380 – minor support
9310 – stronger support and potential demand zone
Outlook:
Bullish bias remains intact while the FTSE holds above 9420. A sustained break below this level could shift momentum to the downside in the short term.
This communication is for informational purposes only and should not be viewed as any form of recommendation as to a particular course of action or as investment advice. It is not intended as an offer or solicitation for the purchase or sale of any financial instrument or as an official confirmation of any transaction. Opinions, estimates and assumptions expressed herein are made as of the date of this communication and are subject to change without notice. This communication has been prepared based upon information, including market prices, data and other information, believed to be reliable; however, Trade Nation does not warrant its completeness or accuracy. All market prices and market data contained in or attached to this communication are indicative and subject to change without notice.

FTSE oversold rally resistance at 9700The FTSE remains in a bullish trend, with recent price action showing signs of a corrective pullback within the broader uptrend.
Support Zone: 9490 – a key level from previous consolidation. Price is currently testing or approaching this level.
A bullish rebound from 9490 would confirm ongoing upside momentum, with potential targets at:
9700 – initial resistance
9740 – psychological and structural level
9790 – extended resistance on the longer-term chart
Bearish Scenario:
A confirmed break and daily close below 9490 would weaken the bullish outlook and suggest deeper downside risk toward:
9420 – minor support
9310 – stronger support and potential demand zone
Outlook:
Bullish bias remains intact while the FTSE holds above 9490. A sustained break below this level could shift momentum to the downside in the short term.
This communication is for informational purposes only and should not be viewed as any form of recommendation as to a particular course of action or as investment advice. It is not intended as an offer or solicitation for the purchase or sale of any financial instrument or as an official confirmation of any transaction. Opinions, estimates and assumptions expressed herein are made as of the date of this communication and are subject to change without notice. This communication has been prepared based upon information, including market prices, data and other information, believed to be reliable; however, Trade Nation does not warrant its completeness or accuracy. All market prices and market data contained in or attached to this communication are indicative and subject to change without notice.

Bearish drop off?UK100 is rising towards the pivot which acts as a pullback resistance and could drop to the 1st support.
Pivot: 9,619.98
1st Support: 9,383.67
1st Resistance: 9,784.68
Disclaimer:
The opinions given above constitute general market commentary and do not constitute the opinion or advice of IC Markets or any form of personal or investment advice.
Any opinions, news, research, analyses, prices, other information, or links to third-party sites contained on this website are provided on an "as-is" basis, are intended to be informative only, and are not advice, a recommendation, research, a record of our trading prices, an offer of, or solicitation for, a transaction in any financial instrument and thus should not be treated as such. The information provided does not involve any specific investment objectives, financial situation, or needs of any specific person who may receive it. Please be aware that past performance is not a reliable indicator of future performance and/or results. Past performance or forward-looking scenarios based upon the reasonable beliefs of the third-party provider are not a guarantee of future performance. Actual results may differ materially from those anticipated in forward-looking or past performance statements. IC Markets makes no representation or warranty and assumes no liability as to the accuracy or completeness of the information provided, nor any loss arising from any investment based on a recommendation, forecast, or any information supplied by any third party.

FTSE retest of important 9660 supportThe FTSE remains in a bullish trend, with recent price action showing signs of a corrective pullback within the broader uptrend.
Support Zone: 9660 – a key level from previous consolidation. Price is currently testing or approaching this level.
A bullish rebound from 9660 would confirm ongoing upside momentum, with potential targets at:
9790 – initial resistance
9830 – psychological and structural level
9700 – extended resistance on the longer-term chart
Bearish Scenario:
A confirmed break and daily close below 9660 would weaken the bullish outlook and suggest deeper downside risk toward:
9610 – minor support
9556 – stronger support and potential demand zone
Outlook:
Bullish bias remains intact while the FTSE holds above 9660. A sustained break below this level could shift momentum to the downside in the short term.
This communication is for informational purposes only and should not be viewed as any form of recommendation as to a particular course of action or as investment advice. It is not intended as an offer or solicitation for the purchase or sale of any financial instrument or as an official confirmation of any transaction. Opinions, estimates and assumptions expressed herein are made as of the date of this communication and are subject to change without notice. This communication has been prepared based upon information, including market prices, data and other information, believed to be reliable; however, Trade Nation does not warrant its completeness or accuracy. All market prices and market data contained in or attached to this communication are indicative and subject to change without notice.

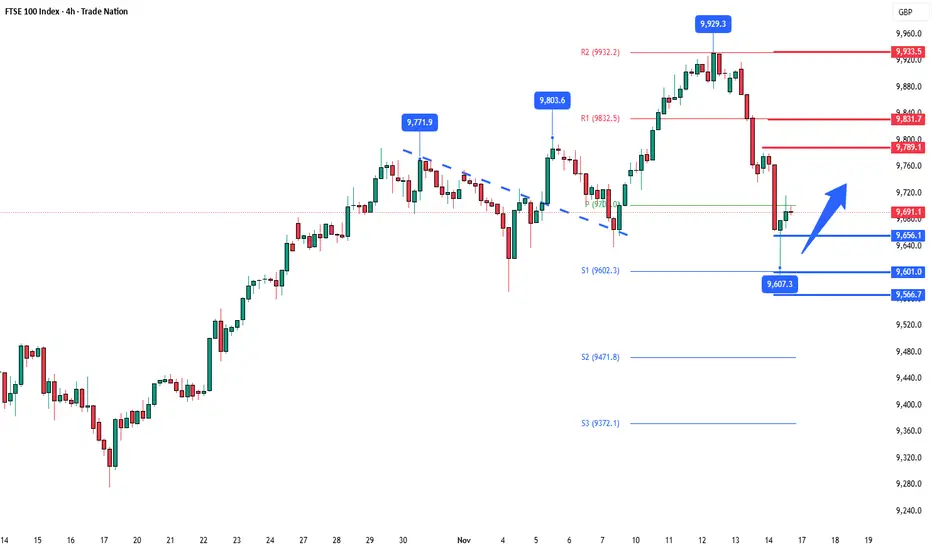
FTSE100 The Week Ahead Key Trading LevelsKey Support and Resistance Levels
Resistance Level 1: 9790
Resistance Level 2: 9830
Resistance Level 3: 9933
Support Level 1: 9656
Support Level 2: 9600
Support Level 3: 9566
This communication is for informational purposes only and should not be viewed as any form of recommendation as to a particular course of action or as investment advice. It is not intended as an offer or solicitation for the purchase or sale of any financial instrument or as an official confirmation of any transaction. Opinions, estimates and assumptions expressed herein are made as of the date of this communication and are subject to change without notice. This communication has been prepared based upon information, including market prices, data and other information, believed to be reliable; however, Trade Nation does not warrant its completeness or accuracy. All market prices and market data contained in or attached to this communication are indicative and subject to change without notice.
FTSE 100 (UKX) | Targeting 17K → 23K → 50K The British Bull Awakens 🏴📈 | The British Bull Awakens 🏴📈 | The British Bull Awakens 🏴📈
Macro Wave 3 of SuperCycle 3 in full motion — 17K next, then 23K before Wave 4 reset and grand finale 50K .
The FTSE 100 is mid-way through its most powerful Elliott Wave phase in decades — Macro Wave (3) of SuperCycle (3).
A generational breakout is forming, with Fibonacci confluence and institutional flow pointing toward 17K and beyond. ⚡
🧩 The SuperCycle Map
📈 SuperCycle Wave (1) (1989–2000) → Globalization & tech boom = foundation of modern bull market.
📉 SuperCycle Wave (2) (2000–2009) → Dot-com + GFC reset the system with a 0.618 retrace.
⚡ SuperCycle Wave (3) (2009–Present) → Now in progress — a generational expansion wave unfolding.
Inside it:
Macro (1): 2009–2018 post-crisis recovery
Macro (2): 2018–2020 correction
Macro (3): 2020–Now → Targeting ~17,000
Macro (4): 2029–2033 est. → Retrace to 10–12K
Macro (5): 2033–2037 est. → Push to ~23,000
Then:
🌀 SuperCycle (4) = multi-year correction
🌟 SuperCycle (5) = grand finale toward ~50,000
💹 Wave Confluence & Fibonacci Geometry
2.618 extension → 17K (Macro 3 target)
3.618 extension → 23K (Macro 5 projection)
Historic 0.5–0.618 retraces at every cycle confirm proportional balance.
Long-term regression & wave symmetry both support this structure.
🧭 Smart Money & Market Structure
✅ Accumulation base: 7K–9K (institutional demand zones)
✅ Break of Structure (BoS) → confirmed expansion
✅ Fair Value Gaps below 9K → future liquidity magnets for Macro 4
✅ Continuous higher highs & order block footprints = Smart Money in control
📊 The FTSE remains in expansion phase , pushing through new structural highs as liquidity builds.
🌍 Macro Fundamentals
UK equities undervalued vs. global peers
Normalizing rates + disinflation = valuation tailwinds
Long-term flows into energy, AI, infrastructure
Institutional rotation into real assets supports the multi-decade rally
🎯 Targets Ahead
📍 Macro 3 (short-term): ~17,000
🔄 Macro 4 retrace: ~10–12K
🚀 Macro 5: ~23,000
🌀 SuperCycle 4 correction: multi-year base
🌟 SuperCycle 5: ~50,000
📈 This is the belief phase of a generational bull market — Macro Wave (3) within SuperCycle (3).
Patience now could pay off for decades.
💬 What’s your FTSE target — 17K, 23K, or 50K?
👇 Comment below and Follow for future wave updates & Smart Money confluence setups.
— Team FIBCOS
#FTSE100 #ElliottWave #SmartMoneyConcept #Fibonacci #WaveTheory #MarketStructure #MacroInvesting #TradingView #FIBCOS #BullMarket #Wave3 #PriceAction #UKX #Investing #MacroCycle

