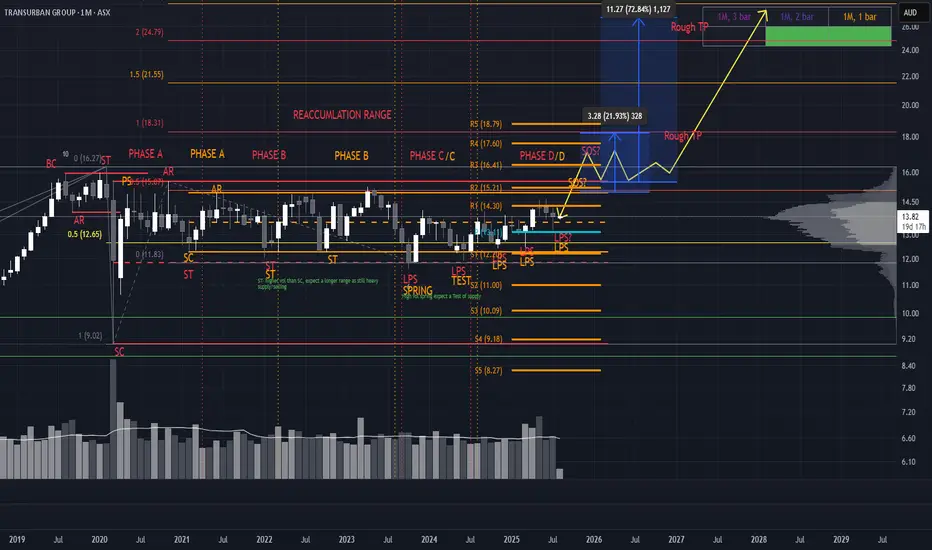
Two Ranges, One Breakout: TCL’s Wyckoff-Gann ConfluenceCurrently tracking two distinct Wyckoff ranges on TCL, each color-coded for clarity. The structure is clean despite a few lines—each range tells a story.
Accumulation Zones
Key buying opportunities are emerging at the LPS (Last Point of Support), marked by higher lows. These are classic signs of s
Next report date
—
Report period
—
EPS estimate
—
Revenue estimate
—
0.03 USD
87.46 M USD
2.59 B USD
3.11 B
About Transurban Group Ltd.
Sector
Industry
CEO
Michelle Jablko
Website
Headquarters
Docklands
Founded
1996
ISIN
AU000000TCL6
FIGI
BBG000P252K5
Transurban Group Ltd. engages in the development, operation, and maintenance of toll roads. It operates through the following geographical segments: Melbourne, Sydney, Brisbane, North America, and Corporate and Other. The company was founded in 1996 and is headquartered in Docklands, Australia.
Related stocks
ASX: TCL 22 APR 2024ASX: TRANSURBAN GROUP - TCL: 22 APR 2024 | Semilog Scale 1D Chart
© Master of Elliott Wave Analysis: Shane Hua, CEWA-M.
Details: The short-term outlook indicates that wave 2-red is unfolding, subdividing into waves ((a)) and ((b))-green, which have completed. Now, wave ((c))-green is unfolding, and

Pitchfork supportfollowing trend support ay $14 and then run to $16 by end of year (maybe), if it falls down to 13.59 the trend is done

Buying pullbacklooking good for third accumulation if it pulls back down to 13.75 , a long term plan but looking OK so far

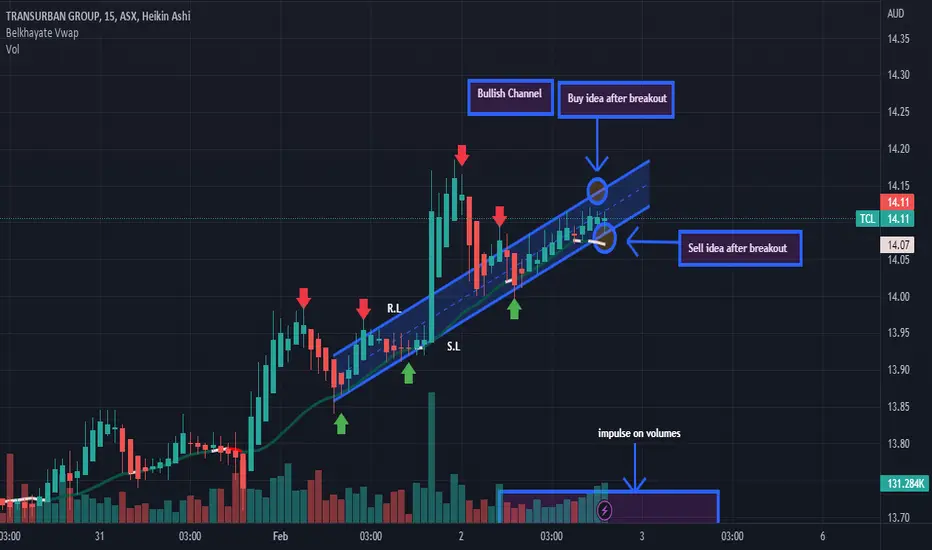
Analysis: two situations: Bullish channelHere we have two situations. We will have a buy idea if we have the breakout with force the resistance line. In other hand we could have a sell idea if we have the breakout with force the support line and the vwap indicator.Thanks!
TCL - Golden Cross usually provides Bullish OutcomeThe price chart of Transurban Group ( TCL ) has just triggered a Golden Cross (50-day moving average above 200-day moving average). Historically, this price pattern was usually followed by an upside move. Since 2000, a Golden Cross has been observed on 13 previous occasions (first event in at least

Position Reversal on TCL explained on 4HOUR chartsTCL :
Reversal formation on 4 hour charts after break out on a long consolidation over 30 days now in Long run back to 14.91 and 15.65

Transurban about to break a long term resistancePrice ACTION - TCL is breaking a key resistance level reversing a downward swing back to previous highs.
4 hour chart
Condition - BReak of 13.81 with good volumes
Stock target - 14.31
Target 2 - 14.91
Target 3 - 15.63
Timeframe - 6- 8 Weeks
Stop Loss - Swing Low - 13.44
Pattern - Round Bot


See all ideas
Summarizing what the indicators are suggesting.
Neutral
SellBuy
Strong sellStrong buy
Strong sellSellNeutralBuyStrong buy
Neutral
SellBuy
Strong sellStrong buy
Strong sellSellNeutralBuyStrong buy
Neutral
SellBuy
Strong sellStrong buy
Strong sellSellNeutralBuyStrong buy
An aggregate view of professional's ratings.
Neutral
SellBuy
Strong sellStrong buy
Strong sellSellNeutralBuyStrong buy
Neutral
SellBuy
Strong sellStrong buy
Strong sellSellNeutralBuyStrong buy
Neutral
SellBuy
Strong sellStrong buy
Strong sellSellNeutralBuyStrong buy
Displays a symbol's price movements over previous years to identify recurring trends.
T
XS304743573
Transurban Finance Co. Pty Ltd. 6.6087% 17-APR-2040Yield to maturity
5.89%
Maturity date
Apr 17, 2040
T
AU3CB027995
Transurban Queensland Finance Pty Ltd. 3.25% 05-AUG-2031Yield to maturity
5.58%
Maturity date
Aug 5, 2031
T
USQ9194UBJ0
Transurban Finance Co. Pty Ltd. 4.924% 24-MAR-2036Yield to maturity
5.05%
Maturity date
Mar 24, 2036
T
TRAUF5126277
Transurban Queensland Finance Pty Ltd. 4.5% 19-APR-2028Yield to maturity
4.68%
Maturity date
Apr 19, 2028
T
USQ9194UBC5
Transurban Finance Co. Pty Ltd. 2.45% 16-MAR-2031Yield to maturity
4.42%
Maturity date
Mar 16, 2031
T
TNAB
Transurban Finance Co. Pty Ltd. 3.375% 22-MAR-2027Yield to maturity
4.14%
Maturity date
Mar 22, 2027
T
XS323597456
Transurban Finance Co. Pty Ltd. 4.033% 26-NOV-2037Yield to maturity
4.03%
Maturity date
Nov 26, 2037
T
XS304743565
Transurban Finance Co. Pty Ltd. 4.143% 17-APR-2035Yield to maturity
3.84%
Maturity date
Apr 17, 2035
T
XS202147089
Transurban Finance Co. Pty Ltd. 1.701% 03-JUL-2034Yield to maturity
3.58%
Maturity date
Jul 3, 2034
See all TRAUF bonds
Frequently Asked Questions
The current price of TRAUF is 10.12 USD — it has increased by 0.62% in the past 24 hours. Watch Transurban Group stock price performance more closely on the chart.
Depending on the exchange, the stock ticker may vary. For instance, on OTC exchange Transurban Group stocks are traded under the ticker TRAUF.
TRAUF stock has risen by 0.62% compared to the previous week, the month change is a 9.68% rise, over the last year Transurban Group has showed a 22.64% increase.
We've gathered analysts' opinions on Transurban Group future price: according to them, TRAUF price has a max estimate of 10.54 USD and a min estimate of 8.77 USD. Watch TRAUF chart and read a more detailed Transurban Group stock forecast: see what analysts think of Transurban Group and suggest that you do with its stocks.
TRAUF reached its all-time high on Nov 11, 2020 with the price of 11.44 USD, and its all-time low was 2.45 USD and was reached on Mar 6, 2009. View more price dynamics on TRAUF chart.
See other stocks reaching their highest and lowest prices.
See other stocks reaching their highest and lowest prices.
TRAUF stock is 0.90% volatile and has beta coefficient of 0.21. Track Transurban Group stock price on the chart and check out the list of the most volatile stocks — is Transurban Group there?
Today Transurban Group has the market capitalization of 30.86 B, it has increased by 0.14% over the last week.
Yes, you can track Transurban Group financials in yearly and quarterly reports right on TradingView.
Transurban Group is going to release the next earnings report on Feb 19, 2026. Keep track of upcoming events with our Earnings Calendar.
TRAUF earnings for the last half-year are 0.02 USD per share, whereas the estimation was 0.03 USD, resulting in a −28.14% surprise. The estimated earnings for the next half-year are 0.05 USD per share. See more details about Transurban Group earnings.
Transurban Group revenue for the last half-year amounts to 1.24 B USD, despite the estimated figure of 1.26 B USD. In the next half-year revenue is expected to reach 1.37 B USD.
TRAUF net income for the last half-year is 118.36 M USD, while the previous report showed −29.08 M USD of net income which accounts for 507.07% change. Track more Transurban Group financial stats to get the full picture.
Transurban Group dividend yield was 4.65% in 2025, and payout ratio reached 1.52 K%. The year before the numbers were 5.00% and 587.68% correspondingly. See high-dividend stocks and find more opportunities for your portfolio.
As of Dec 7, 2025, the company has 8.2 K employees. See our rating of the largest employees — is Transurban Group on this list?
EBITDA measures a company's operating performance, its growth signifies an improvement in the efficiency of a company. Transurban Group EBITDA is 1.42 B USD, and current EBITDA margin is 54.82%. See more stats in Transurban Group financial statements.
Like other stocks, TRAUF shares are traded on stock exchanges, e.g. Nasdaq, Nyse, Euronext, and the easiest way to buy them is through an online stock broker. To do this, you need to open an account and follow a broker's procedures, then start trading. You can trade Transurban Group stock right from TradingView charts — choose your broker and connect to your account.
Investing in stocks requires a comprehensive research: you should carefully study all the available data, e.g. company's financials, related news, and its technical analysis. So Transurban Group technincal analysis shows the buy rating today, and its 1 week rating is buy. Since market conditions are prone to changes, it's worth looking a bit further into the future — according to the 1 month rating Transurban Group stock shows the strong buy signal. See more of Transurban Group technicals for a more comprehensive analysis.
If you're still not sure, try looking for inspiration in our curated watchlists.
If you're still not sure, try looking for inspiration in our curated watchlists.