Same for Sixth Street. TSLX We are not in the business of getting every prediction right, no one ever does and that is not the aim of the game. The Fibonacci targets are highlighted in purple with invalidation in red. Confirmation level, where relevant, is a pink dotted, finite line. Fibonacci goals, it is prudent to suggest,
2.61USD
222.02 MUSD
421.10 MUSD
91.32 M
About Sixth Street Specialty Lending, Inc.
Sector
Industry
CEO
Joshua William Easterly
Headquarters
New York
Founded
2010
ISIN
US83012A1097
FIGI
BBG001DFW799
Sixth Street Specialty Lending, Inc. engages in the provision of financing solutions. It invests in first-lien debt, second-lien debt, mezzanine and unsecured debt or equity or other securities issued by middle-market companies.

TSLX Breakout8 Month Long Ascending Triangle
Steady Uptrend
Good Earnings
Pays out dividends as well
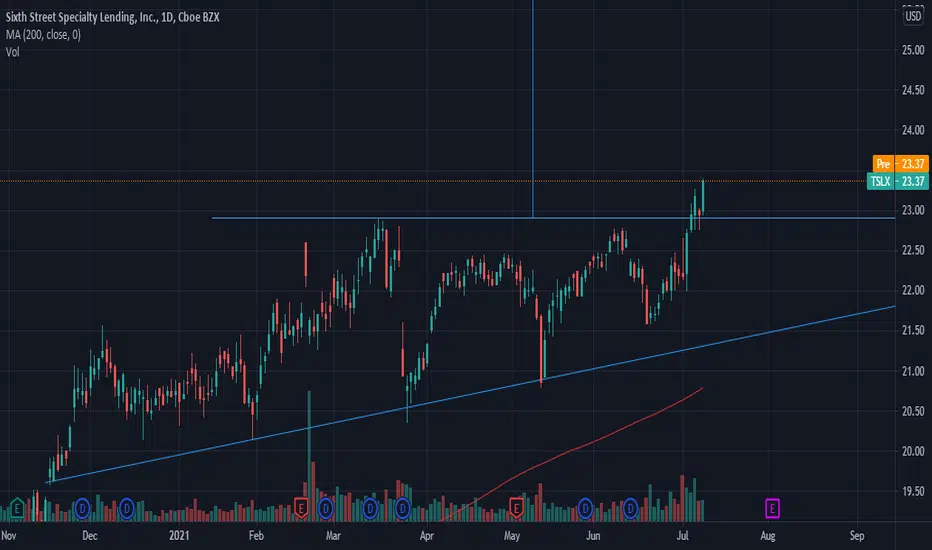
TSLX a trustworthy BUY for longThis company is doing better YoY and looks to be a stock set to surge. Wells Fargo has been making some Americanized purchases to try to build trust. Maybe this is one of them. WFC added about 3,211% of TSLX to it's portfolio according to it's May 1st 13F filing. I would wait for a perfect entry

See all ideas
Trade directly on the supercharts through our supported, fully-verified and user-reviewed brokers.


Frequently Asked Questions
The current price of TSLX is 20.91 USD — it has increased by 0.38% in the past 24 hours.
Depending on the exchange, the stock ticker may vary. For instance, on NYSE exchange Sixth Street Specialty Lending, Inc. stocks are traded under the ticker TSLX.
Sixth Street Specialty Lending, Inc. is going to release the next earnings report on May 1, 2024. Keep track of upcoming events with our Earnings Calendar.
TSLX stock is 1.15% volatile and has beta coefficient of 0.58. Check out the list of the most volatile stocks — is Sixth Street Specialty Lending, Inc. there?
One year price forecast for Sixth Street Specialty Lending, Inc. has a max estimate of 23.50 USD and a min estimate of 22.00 USD.
TSLX earnings for the last quarter are 0.57 USD per share, whereas the estimation was 0.57 USD resulting in a 0.66% surprise. The estimated earnings for the next quarter are 0.58 USD per share. See more details about Sixth Street Specialty Lending, Inc. earnings.
Sixth Street Specialty Lending, Inc. revenue for the last quarter amounts to 114.40 M USD despite the estimated figure of 109.72 M USD. In the next quarter revenue is expected to reach 113.52 M USD.
Yes, you can track Sixth Street Specialty Lending, Inc. financials in yearly and quarterly reports right on TradingView.
TSLX stock has fallen by 0.43% compared to the previous week, the month change is a 0.77% rise, over the last year Sixth Street Specialty Lending, Inc. has showed a 16.17% increase.
TSLX net income for the last quarter is 51.16 M USD, while the quarter before that showed 64.82 M USD of net income which accounts for −21.07% change. Track more Sixth Street Specialty Lending, Inc. financial stats to get the full picture.
Today Sixth Street Specialty Lending, Inc. has the market capitalization of 1.91 B, it has decreased by 0.38% over the last week.
Yes, TSLX dividends are paid quarterly. The last dividend per share was 0.46 USD. As of today, Dividend Yield (TTM)% is 8.83%. Tracking Sixth Street Specialty Lending, Inc. dividends might help you take more informed decisions.
Sixth Street Specialty Lending, Inc. dividend yield was 8.52% in 2023, and payout ratio reached 70.55%. The year before the numbers were 9.49% and 122.30% correspondingly. See high-dividend stocks and find more opportunities for your portfolio.
Like other stocks, TSLX shares are traded on stock exchanges, e.g. Nasdaq, Nyse, Euronext, and the easiest way to buy them is through an online stock broker. To do this, you need to open an account and follow a broker's procedures, then start trading. You can trade Sixth Street Specialty Lending, Inc. stock right from TradingView charts — choose your broker and connect to your account.
Investing in stocks requires a comprehensive research: you should carefully study all the available data, e.g. company's financials, related news, and its technical analysis. So Sixth Street Specialty Lending, Inc. technincal analysis shows the sell today, and its 1 week rating is neutral. Since market conditions are prone to changes, it's worth looking a bit further into the future — according to the 1 month rating Sixth Street Specialty Lending, Inc. stock shows the buy signal. See more of Sixth Street Specialty Lending, Inc. technicals for a more comprehensive analysis.
If you're still not sure, try looking for inspiration in our curated watchlists.
If you're still not sure, try looking for inspiration in our curated watchlists.
We've gathered analysts' opinions on Sixth Street Specialty Lending, Inc. future price: according to them, TSLX price has a max estimate of 23.50 USD and a min estimate of 22.00 USD. Read a more detailed Sixth Street Specialty Lending, Inc. forecast: see what analysts think of Sixth Street Specialty Lending, Inc. and suggest that you do with its stocks.
EBITDA measures a company's operating performance, its growth signifies an improvement in the efficiency of a company. Sixth Street Specialty Lending, Inc. EBITDA is 334.54 M USD, and current EBITDA margin is 79.44%. See more stats in Sixth Street Specialty Lending, Inc. financial statements.