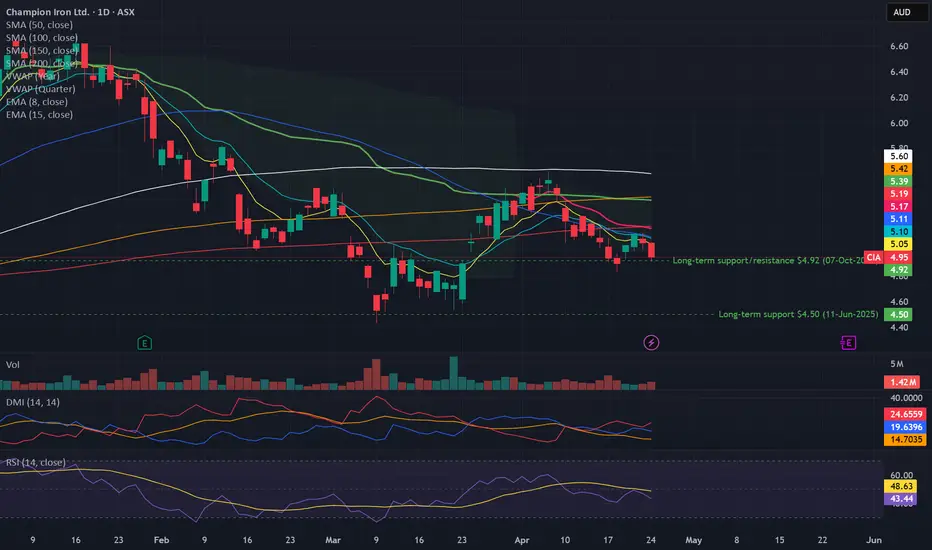
Bearish potential detected for CIAEntry conditions:
(i) lower share price for ASX:CIA along with swing of DMI indicator towards bearishness and RSI downwards, and
(ii) observing market reaction around the potential support area of $4.92 from the open of 7th October 2025.
Depending on risk tolerance, the stop loss for the trade wo
Champion Iron Ltd.
No trades
No trades
Compare with Champion Iron Ltd.
0.22 CAD
177.32 M CAD
1.86 B CAD
387.31 M
Next report date
—
Report period
—
EPS estimate
—
Revenue estimate
—
Company info
Sector
Industry
CEO
David Cataford
Website
Headquarters
Rozelle
Founded
2006
IPO date
Jun 8, 2007
ISIN
AU000000CIA2
FIGI
BBG0068DZ331
Identifiers
ISIN AU000000CIA2
Champion Iron Ltd. engages in the production, exploration, and development of iron ore properties. It operates through the following segments: Iron Ore Concentrate, Exploration and Evaluation, and Corporate. Its portfolio includes Bloom Lake and Consolidated Fire Lake North. The company was founded on May 18, 2006 and is headquartered in Rozelle, Australia.
$CIA Reigning in on a ReRate x Pre-operational KamiBear:
Iron ore prices collapse (China slowdown, oversupply). P65 drops to ~US$110/t. DRPF ramp delayed or disappoints. Margin hit to ~22% from high fixed costs. Market de-rates to 5× on sector pessimism.
Base:
Stable demand, P65 ~US$130/t. DRPF successfully commissioned, lifting ~50% of output to
CIA - 28 months ASCENDING TRIANGLE══════════════════════════════
Since 2014, my markets approach is to spot
trading opportunities based solely on the
development of
CLASSICAL CHART PATTERNS
🤝Let’s learn and grow together 🤝
══════════════════════════════
Hello Traders ✌
After a careful consideration I came to the conclusion that:
-
CIA ~ Snapshot TA / Psychotic Yo-Yo YOLO (Weekly Chart)Title pretty much sums up Champion Iron's recent price action lol.
Reminds me of similar movements exhibited in Mineral Resources chart before getting pumped after diversifying into Lithium.
Held onto a trend-line that's been running since 2015, crazy.
Appears ~$8 is established resistance level,
CIA.ASX_Bullish Value Trade_longENTRY: 7.65
SL: 7.09
TP: 8.07
- RSI: 14 Mar 2023 shows reverse from 38-39 level.
- Stoch: 14 Mar 2023 shows reverse from ~20 level.
- VI: +ve and -ve converging
- Rebound 3 times when approach POC area (white dotted lines)
- Convergence of horizontal and trendline value area (solid yellow lines).
-
CIA - Blue Sky DaysChampion Iron (CIA ASX analysis) has been in a long term consolidation pattern since July 2021. You can see that it has now been in the $7.80-$8 range for the third time.
The pattern appears to be an ascending triangle - either way, we are seeing higher lows and supply move in at $8. Importantly CI
CIA.ASX_Breakout Retracement Trade_longENTRY: 7.25
SL: 6.68
TP: 7.86
- ADX<20. Would like to be higher.
- Daily RS +ve
- Daily FFI +ve
- Weekly RS +ve
- Weekly FFI +ve
- Moving averages are aligned
- Breakout on 22 Mar 2022 from down-trendline and 7.23 resistance.
- Retraced and tested resistance-turn-support and down-trendline with reb
See all ideas
Summarizing what the indicators are suggesting.
Neutral
Neutral
Neutral
An aggregate view of professional's ratings.
Neutral
Neutral
Neutral
Displays a symbol's price movements over previous years to identify recurring trends.
Frequently asked questions
The current price of CIA is 2.33 CAD — it has decreased by −9.09% in the past 24 hours. Watch Champion Iron Ltd. stock price performance more closely on the chart.
Depending on the exchange, the stock ticker may vary. For instance, on TSX exchange Champion Iron Ltd. stocks are traded under the ticker CIA.
CIA stock has fallen by −16.67% compared to the previous week, the month change is a −24.05% fall, over the last year Champion Iron Ltd. has showed a −47.64% decrease.
We've gathered analysts' opinions on Champion Iron Ltd. future price: according to them, CIA price has a max estimate of 6.09 CAD and a min estimate of 2.46 CAD. Watch CIA chart and read a more detailed Champion Iron Ltd. stock forecast: see what analysts think of Champion Iron Ltd. and suggest that you do with its stocks.
CIA stock is 3.00% volatile and has beta coefficient of 1.40. Track Champion Iron Ltd. stock price on the chart and check out the list of the most volatile stocks — is Champion Iron Ltd. there?
Today Champion Iron Ltd. has the market capitalization of 1.34 B, it has decreased by −0.64% over the last week.
Yes, you can track Champion Iron Ltd. financials in yearly and quarterly reports right on TradingView.
Champion Iron Ltd. is going to release the next earnings report on Oct 29, 2026. Keep track of upcoming events with our Earnings Calendar.
CIA earnings for the last quarter are −0.06 CAD per share, whereas the estimation was 0.00 CAD resulting in a −1.33 K% surprise. The estimated earnings for the next quarter are −0.01 CAD per share. See more details about Champion Iron Ltd. earnings.
Champion Iron Ltd. revenue for the last quarter amounts to 357.19 M CAD, despite the estimated figure of 412.53 M CAD. In the next quarter, revenue is expected to reach 422.88 M CAD.
CIA net income for the last quarter is −41.55 M CAD, while the quarter before that showed 23.34 M CAD of net income which accounts for 0.00% change. Track more Champion Iron Ltd. financial stats to get the full picture.
Yes, CIA dividends are paid semi-annually. The last dividend per share was 0.02 CAD. As of today, Dividend Yield (TTM)% is 5.34%. Tracking Champion Iron Ltd. dividends might help you take more informed decisions.
Champion Iron Ltd. dividend yield was 2.46% in 2025, and payout ratio reached 37.29%. The year before the numbers were 4.56% and 73.41% correspondingly. See high-dividend stocks and find more opportunities for your portfolio.
EBITDA measures a company's operating performance, its growth signifies an improvement in the efficiency of a company. Champion Iron Ltd. EBITDA is 512.24 M CAD, and current EBITDA margin is 25.07%. See more stats in Champion Iron Ltd. financial statements.
Like other stocks, CIA shares are traded on stock exchanges, e.g. Nasdaq, Nyse, Euronext, and the easiest way to buy them is through an online stock broker. To do this, you need to open an account and follow a broker's procedures, then start trading. You can trade Champion Iron Ltd. stock right from TradingView charts — choose your broker and connect to your account.
Investing in stocks requires a comprehensive research: you should carefully study all the available data, e.g. company's financials, related news, and its technical analysis. So Champion Iron Ltd. technincal analysis shows the strong sell today, and its 1 week rating is strong sell. Since market conditions are prone to changes, it's worth looking a bit further into the future — according to the 1 month rating Champion Iron Ltd. stock shows the strong sell signal. See more of Champion Iron Ltd. technicals for a more comprehensive analysis.