About U.S. Dollar / Japanese Yen
Also known as trading the “gopher” the USDJPY pair is one of the most traded pairs in the world. The value of these currencies when compared to each other is affected by the interest rate differential between the Federal Reserve and the Bank of Japan.

USDJPYConsider initiating a short position now at the current price of 154.50 for USD/JPY. Selling at this level anticipates a decline in the exchange rate of the US dollar against the Japanese yen. Set your stop loss (SL) at 156.00 to limit potential losses in case the market moves against your position.

USD/JPY opportunity emerges with USD/JPY, as the buy zone beckons at the enticing level of 154.70. With a strategic eye on maximizing gains, the take-profit targets are delineated at 155.20, 155.80, and 156.50, each representing a carefully calculated ascent in the trajectory of potential profitability. How

USDJPY: Maintain a good price trend!USD/JPY stabilizes around the 154.50 mark after recouping some of its daily losses on Friday. According to Reuters, a senior Iranian official stated there are no immediate plans for retaliation following Israeli airstrikes. This development coupled with hawkish comments from Federal Reserve official

Latest USDJPY update todayHello dear traders!
USD/JPY remained defensive below 155.00 early Wednesday, as the Japanese Yen received support from the risks of imminent Japanese intervention. A small decline in the US Dollar and US Treasury yields also weighed on the pair ahead of much Fedspeak.
On the other hand, the US Dol

USD/JPY is identified at 154.42The current selling zone for USD/JPY is identified at 154.42. In this zone, traders may consider executing sell orders to capitalize on potential downward movements in the currency pair. Setting take-profit levels at 153.50, 153.00, and 152.00 allows traders to secure profits at different price poin

USDJPY → Trade Analysis | SELL SetupHello Traders, here is the full analysis.
I think we can soon see more fall from this range! GOOD LUCK! Great SELL opportunity USDJPY
I still did my best and this is the most likely count for me at the moment.
Support the idea with like and follow my profile TO SEE MORE.
Traders, if you liked this i

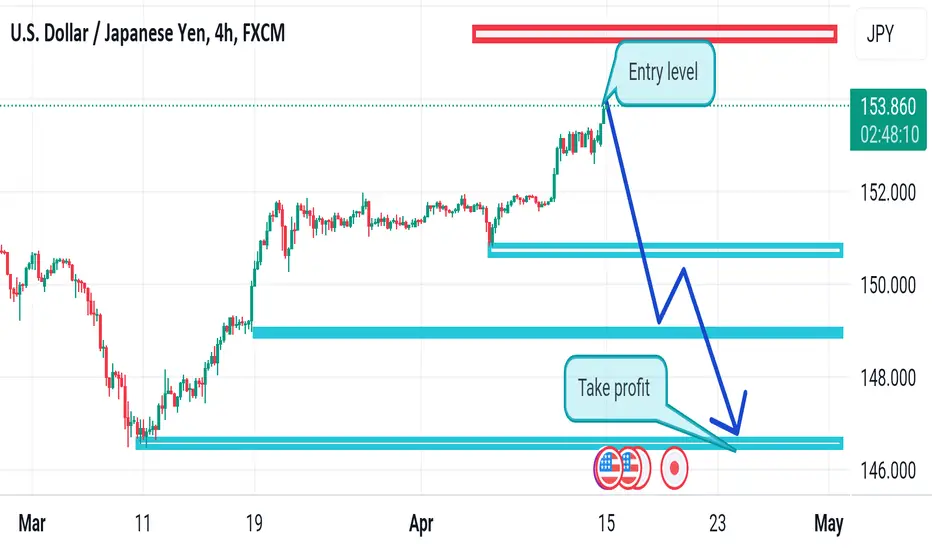
USDJPY wait for -400pips fall and more dump (free signal)As we mentioned before price now is touching our major resistance zone which is form here based on Fibonacci levels and we are looking for a heavy dump here and also we have an open high-risk short now with 1:4 RiskReward.
DISCLAIMER: ((trade based on your own decision))
<

USD/JPY Rebounds: Japan's Intervention Boosts USD/JPYThe strong recovery of the USD/JPY pair is attracting attention, reflecting Japan's intervention to temporarily address the weakness of the Japanese Yen (JPY).
Technically, on the chart, the strength of the upward momentum is clearly evident. The Relative Strength Index (RSI) is stabilizing around

Usdjpy Down range go with trendUSDJPY 1 day chart
For the yen, the move is particularly notable as it pushes into technical blue skies
Eyes are on Japan for signs of intervention but given that the recent move has largely been on broad USD buying following fundamentally stronger CPI numbers, it's a tough one to lean against. Ther
See all ideas