DAX/GER - let puck up the entry againTeam, last week, we got our target hit before the BIG dump again yesterday
Found a good entry for DAX at this level 22993-22965
STOP LOSS at 22860
Once it break above 23060, bring stop loss to BREAK EVEN
Target 1 at 23085-23115
Target 2 at 23160-23189
Target 3 at 23230-23500
LETS GO
Trade ideas
DAX Germany 40 index Sell planSwept PWH.
Market structure shift.
Targetting liqudity Sitting below.
waiting for an pullback above in point of intrest.

Germany Dax Bearish StructureGermany Dax Bearish Structure
trading inside monthly bullish fvg.
i a m expecting 2 cr rejaction .
so recently we have some liqudity siting below,
monthly Liqudity.
Point of intrest marked on chart.
sell DAXgerman DAX now super bearish, price broke its horizontal price range,while VIX coming up strong, there is a lot of downside to anticipate here.
German economy is lacking gdp growth for 3 years in a row now and the outlook is even worse, its about time to sell DAX.

Dax Short Term Sell IdeaH1 - Strong bearish move.
No opposite signs.
Currently it looks like a pullback is happening.
Expecting bearish continuation until the two Fibonacci resistance zones hold.
If you enjoy this idea, don’t forget to LIKE 👍, FOLLOW ✅, SHARE 🙌, and COMMENT ✍! Drop your thoughts and charts below to keep the discussion going. Your support helps keep this content free and reach more people! 🚀
-------------------------------------------------------------------------------------------------------------------

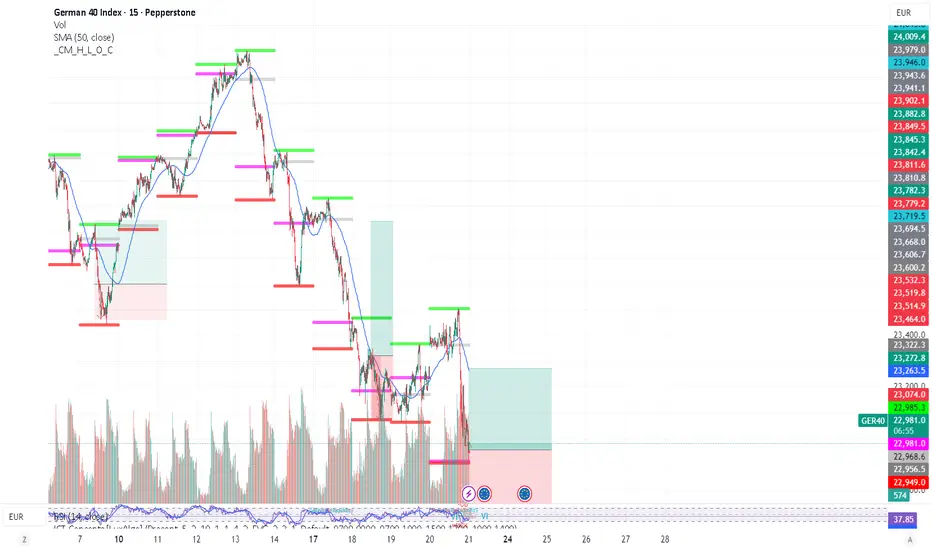
GER40 SELL IDEAIn GER40 analysis we can see that our daily , h4 and m15 timeframes are bearish.. now we're just analysing m15 time frame and in m15 time frame we can see m15 structure is clearly bearish so now it will do pullback .as i marked 2 blue zones which are m15 demand zone for sell... by my perspective from the downside first blue zone(23220.5 - 23123.0),from this zone the market will give us sell entry and till we'll patiently wait ....let's see... :)
24650 Still Holds for DaxDAX still could not break the 24650 resistance. The range is getting tighter and a possible breakout is closing but the direction of the breakout is still a question. Watch 23300 and 24650 as key levels.

$DAX up timeI called for a audacious short of DAX on 23 Oct, saying that it is weak and other indices could follow it. We got a 1200 pts move down to my 23200 price target (), though it did rebounded strongly before going down.
Price is now at monthly support at around 23050. If price could break the downward trendline, could see a recovery to 23940 or so.

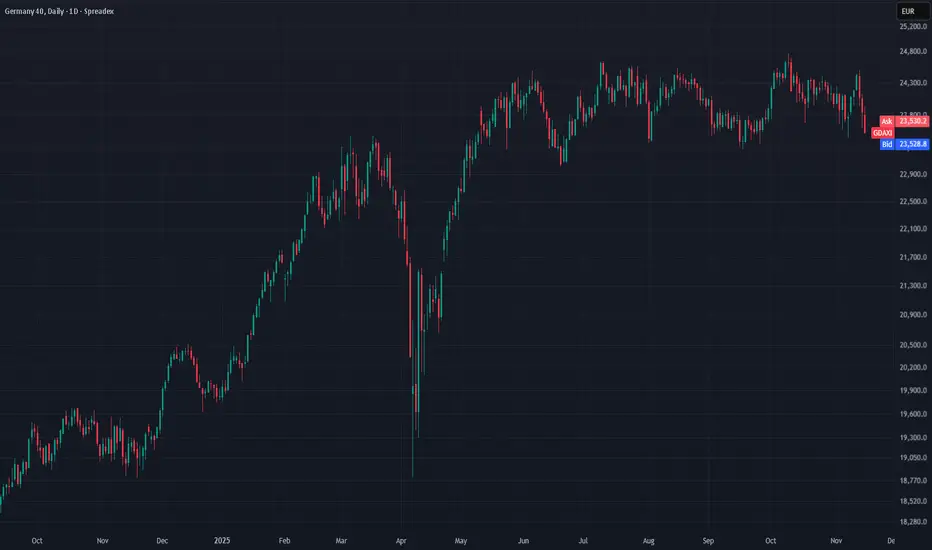
DAX Will the 1W MA50 support once more?DAX (DE40) has been trading within a 3-year Channel Up, essentially for the entirety of its Bull Cycle, following the October 2022 bottom of the Inflation Crisis.
The most common Support, hence optimal long-term buy signal/ entry within this pattern, has been the 1W MA50 (blue trend-line), having been hit three times and providing on all instances massive rallies.
Every time that or the 1W MA100 (green trend-line) were hit, the rallies always hit the previous High/ Resistance 1 initially before either a consolidation or a slight pull-back.
As a result, if the market hits the 1W MA50 but manages to close the 1W candle above it, we expect the resulting rally to hit at least 24700 (Resistance 1).
Notice also that every long-term Bullish Leg was confirmed after the 1W RSI broke above its Lower Highs trend-line.
---
** Please LIKE 👍, FOLLOW ✅, SHARE 🙌 and COMMENT ✍ if you enjoy this idea! Also share your ideas and charts in the comments section below! This is best way to keep it relevant, support us, keep the content here free and allow the idea to reach as many people as possible. **
---
💸💸💸💸💸💸
👇 👇 👇 👇 👇 👇


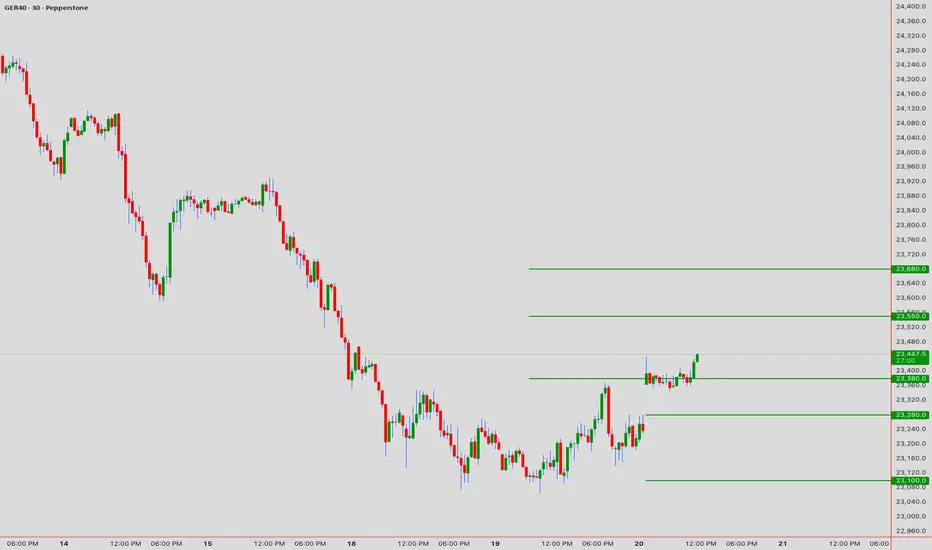
DAX40 bearish below resistance at 23550The DAX40 is currently trading with a bearish bias, aligned with the broader downward trend. Recent price action shows a retest of the support, suggesting a possibility of a temporary relief rally within the downtrend.
Key resistance is located at 23550, a prior consolidation zone. This level will be critical in determining the next directional move.
A bearish rejection from 23550 could confirm the resumption of the downtrend, targeting the next support levels at 23093, followed by 22800 and 22580 over a longer timeframe.
Conversely, a decisive breakout and daily close above 23550 would invalidate the current bearish setup, shifting sentiment to bullish and potentially triggering a move towards 23790, then 23980.
Conclusion:
The short-term outlook remains bearish unless the DAX40 breaks and holds above 23550. Traders should watch for price action signals around this key level to confirm direction. A rejection favours fresh downside continuation, while a breakout signals a potential trend reversal or deeper correction.
This communication is for informational purposes only and should not be viewed as any form of recommendation as to a particular course of action or as investment advice. It is not intended as an offer or solicitation for the purchase or sale of any financial instrument or as an official confirmation of any transaction. Opinions, estimates and assumptions expressed herein are made as of the date of this communication and are subject to change without notice. This communication has been prepared based upon information, including market prices, data and other information, believed to be reliable; however, Trade Nation does not warrant its completeness or accuracy. All market prices and market data contained in or attached to this communication are indicative and subject to change without notice.

Dax into the open.Thursday 20th NovemberPattern is bullish
Overhead rez @ 23.5K and 23.6K
Lets see what happens

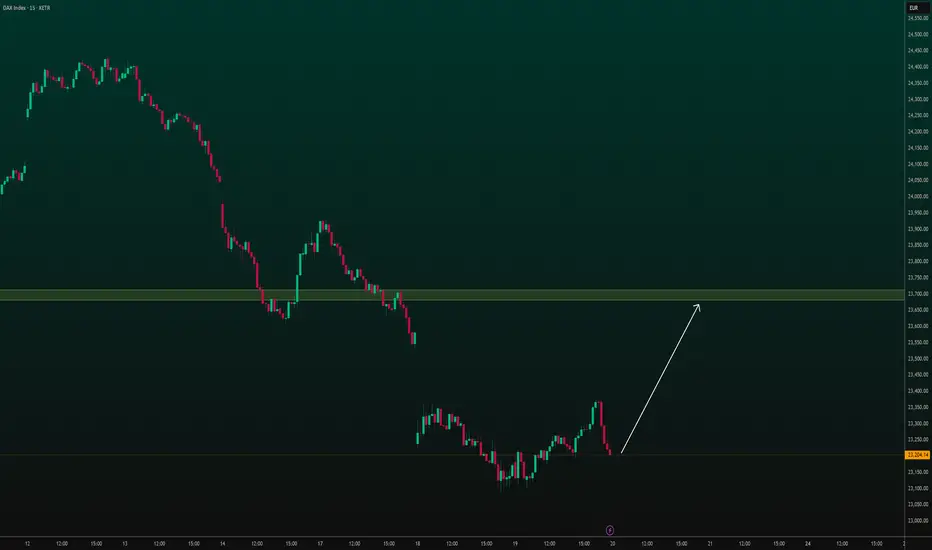
DAX - Potential Rebound from SupportAfter a significant downtrend, the DAX appears to be finding strong support. Price has shown a bounce and the white arrow indicates a potential move towards the resistance zone.
DAX/GER - LETS PICK THE GROUND PRICE Team,
DAX price is good entry at 23350-23330
stop loss at 23250
Target 1 at 23397-23435 - take 30% partial and bring stop loss to BE
Target 2 at 23460+23515
MEDIUM LONG TERM HOLD OR SWING trade TARGET 3 at 23550-23750
LETS GO

Ger30We can see that price has restest the previous demand zone to be strong level of support, and more bullish momentumm still expected till the supply formed.

Technical Analysis WeeklyGermany 40 is in a neutral range after avoiding a major breakdown, trading at 23,503 near the VWAP of 23,616. RSI at 44.9 indicates indecision. Support is at 22,866, resistance at 24,366.
Wall Street remains bullish but is now in a correction phase, trading at 47,515 above the VWAP at 46,903 but below former highs. RSI at 56.9 suggests a resumption of bullish momentum. Support is at 45,592, resistance at 48,214.
UK 100 continues to trend bullishly but is rebounding inside a correction phase. Price is at 9,707, just above the VWAP of 9,667. RSI at 54.7 reflects neutral momentum. Support is 9,439, with resistance at 9,895.
GBP/USD is in a bearish correction phase - rebounding after a breakdown from its former range, with price at 1.3232 just above VWAP at 1.3155. RSI of 56.2 hints at mild rebound potential. Support is at 1.3043, resistance at 1.3267.
EUR/USD continues within a neutral range, having not taken out significant formers lows, trading at 1.1626 slightly above VWAP of 1.1574. RSI at 58.8 signals modest bullish bias. Support is 1.1497, resistance at 1.1652.
USD/JPY is undergoing a pullback within its bullish trend after testing multi-year highs, trading at 155.12 under the VWAP of 155.50. RSI at 50.8 reflects balanced momentum. Support is at 153.35, resistance at 157.66.
Gold is rallying again after breaking out of a triangle pattern but is still in a correction phase below former highs within its bullish trend, trading at 4,256 above VWAP of 4,117. RSI at 66.3 signals continued strength. Support lies at 3,986 with resistance at 4,256.
Brent Crude remains in a neutral range, having avoided a breakdown below the key 6,000 figure, trading at 6,310 on top of its VWAP of 6,300. RSI at 49.3 indicates balanced conditions. Support is at 6,140, with resistance at 6,481.

Dax.Monday 24th NovemberA wodge of resistance is looming.Above 23400 does not seem to be liked
Latest movement is a bullish pattern
Lets see what happens

German DAX: Testing Critical Support After Rejection
The GER40 is currently positioned at 23,432.7 , and we're witnessing a pivotal moment in the intraday structure. The index has pulled back from recent highs, and multiple technical signals are flashing across our radar. Let's break down what matters for today's session. 📊
Current Market Landscape
The 4H chart reveals a Rising Wedge pattern that's showing signs of exhaustion. This bearish reversal formation developed over the past week, and we've just seen a breakdown from the lower trendline. The wedge measured move projects downside potential toward 23,200-23,150.
From a Wyckoff distribution perspective, the recent price action exhibits classic topping characteristics. We observed:
Buying Climax (BC) near 23,680
Automatic Reaction (AR) down to 23,380
Secondary Test (ST) failing at 23,620
Sign of Weakness (SOW) currently unfolding
This distribution schematic suggests institutional selling pressure is building.
Elliott Wave Framework 🌊
The wave structure indicates completion of a five-wave impulse from the 23,100 low. Current labeling suggests:
Wave (i)-(v) impulse completed at 23,680
Wave (A) correction down to 23,380
Wave (B) bounce exhausted at 23,550
Wave (C) decline currently in progress (targeting 23,150-23,200)
The internal structure of wave (C) shows three sub-waves developing, with wave iii potentially extending lower.
Key Price Zones 🎯
Resistance Barriers:
R1: 23,520 (broken support turned resistance + 20 EMA on 1H)
R2: 23,620 (failed secondary test + VWAP)
R3: 23,680 (swing high + psychological)
Support Anchors:
S1: 23,380 (initial wave A low + demand zone)
S2: 23,280 (Fibonacci 0.618 retracement)
S3: 23,150 (measured move target + major support)
Technical Indicator Alignment ⚡
RSI (1H): 38.2 - approaching oversold, but no divergence yet
MACD: Bearish crossover confirmed, histogram expanding downward
Bollinger Bands: Price hugging lower band, volatility expanding
Ichimoku Cloud: Price broke below cloud on 1H (bearish shift), Tenkan below Kijun
Volume: Increasing on down moves (confirming selling pressure)
Harmonic Pattern Analysis
A Bearish Bat pattern completed at the 23,680 level:
- X: 23,100
- A: 23,580
- B: 23,320
- C: 23,650
- D: 23,680 (PRZ completion)
The pattern's measured move aligns with our 23,150 target, providing multi-method confluence.
Candlestick Patterns
The 1H chart printed a Bearish Engulfing pattern at 23,550, followed by consecutive bearish candles. This confirms rejection at resistance and validates the distribution narrative.
Trading Game Plan 💼
Scenario A - Continuation Short:
Entry: 23,450 (current area) or 23,520 retest
Target 1: 23,320
Target 2: 23,200
Stop Loss: 23,580
Scenario B - Breakdown Confirmation:
Entry: 23,375 break (below S1 with retest)
Target 1: 23,280
Target 2: 23,150
Stop Loss: 23,460
Timeframe Coordination 🕐
- 5M: Precision entry timing and scalp exits
- 15M: Momentum shifts and micro-structure breaks
- 1H: Primary trend direction and pattern confirmation
- 4H: Macro structure and major support/resistance
Market Outlook
The technical picture is tilted bearish for the immediate term. The rising wedge breakdown, Wyckoff distribution signs, completed harmonic pattern, and bearish Elliott wave count all point toward further downside. The 23,380 level is critical—sustained break below opens the door to 23,150.
However, watch for potential bullish reversal signals if we reach the 23,280-23,200 zone. That's where buyers may step in aggressively. Until then, the path of least resistance is lower. 📉
Trade with discipline, respect your stops, and let the market prove itself. 🎯
---
Disclaimer: This content is for educational purposes only. Trading involves risk. Conduct your own analysis before making trading decisions.
GER40 Bearish Divergence & Structural Breakdown# 🦅 GER40 19th Nov 2025: 📉 Bearish Divergence & Structural Breakdown 🧩
Asset Class: GER40 (CFD SPOT) | Price: 23,147.5 | Time: 10:35 AM UTC+4
Executive Summary
Bias: 🐻 Bearish Reversal / Correction
Signal: 🔴 Short on Rally Rejection
Confidence: ⭐ High (Divergence Confirmation)
Technical Analysis Methodology
Trend: While the daily trend remains bullish, the 4H and 1H charts are showing signs of exhaustion. A Rising Wedge pattern has formed, often a precursor to a bearish reversal. 📉
Momentum: RSI (14) is showing clear bearish divergence at 68.0, failing to make new highs alongside price. This indicates waning buying pressure. ⚠️
Volatility: Price is struggling to hold above the upper Bollinger Band , and a rejection here could trigger a reversion to the mean. VWAP is at 23,120, a critical level to watch. 📊
Patterns: A potential Double Top is forming near the 23,200 resistance zone. A break below the neckline at 23,050 would confirm the reversal. 🧱
Key Levels
🛑 R2: 23,250 (Psychological Barrier)
🚧 R1: 23,200 (Double Top High)
📍 Pivot: 23,147.5 (Current Price)
🛡️ S1: 23,050 (Neckline / EMA 50)
🧱 S2: 22,920 (Key Support Zone)
Actionable Trade Plan
Strategy: Counter-Trend Reversal & Breakdown 📉
Entry 1 (Aggressive): Short Rejection @ 23,180 - 23,200
Entry 2 (Confirmation): Short Breakdown < 23,040
Stop Loss: 23,260 (Above R2/Invalidation)
Take Profit 1: 23,050 🎯
Take Profit 2: 22,920 🎯
Disclaimer: Trading involves risk. This analysis is for educational purposes only.

DAX40 capped at 23550 resistanceThe DAX40 is currently trading with a bearish bias, aligned with the broader downward trend. Recent price action shows a retest of the support, suggesting a possibility of a temporary relief rally within the downtrend.
Key resistance is located at 23550, a prior consolidation zone. This level will be critical in determining the next directional move.
A bearish rejection from 23550 could confirm the resumption of the downtrend, targeting the next support levels at 23093, followed by 22800 and 22580 over a longer timeframe.
Conversely, a decisive breakout and daily close above 23550 would invalidate the current bearish setup, shifting sentiment to bullish and potentially triggering a move towards 23790, then 23980.
Conclusion:
The short-term outlook remains bearish unless the DAX40 breaks and holds above 23550. Traders should watch for price action signals around this key level to confirm direction. A rejection favours fresh downside continuation, while a breakout signals a potential trend reversal or deeper correction.
This communication is for informational purposes only and should not be viewed as any form of recommendation as to a particular course of action or as investment advice. It is not intended as an offer or solicitation for the purchase or sale of any financial instrument or as an official confirmation of any transaction. Opinions, estimates and assumptions expressed herein are made as of the date of this communication and are subject to change without notice. This communication has been prepared based upon information, including market prices, data and other information, believed to be reliable; however, Trade Nation does not warrant its completeness or accuracy. All market prices and market data contained in or attached to this communication are indicative and subject to change without notice.

GER40 Intraday Technical Journal: Navigating the ChopGER40 Intraday Technical Journal: Navigating the Chop (18 Nov 2025)
Disclaimer: This is not financial advice. This journal entry is for educational purposes only.
Asset: GER40 (German 40 Index)
Current Price: 23,260.4
Time of Analysis:9:00 AM UTC+4, 18th Nov 2025
Market Pulse: The GER40 is currently exhibiting signs of consolidation after a recent uptrend. Volume is tapering off, suggesting indecision. The immediate bias is neutral to slightly bearish, with a critical pivot at 23,280. A break above or below this level will likely dictate the next leg of movement.
Intraday Strategy & Key Levels:
Pivot Point: 23,280 - This is our line in the sand for today's session.
Bullish Scenario (Price > 23,280):
Entry: A sustained break and hold above 23,280 could signal a long entry. Confirmation on the 15-min chart is advised.
Targets:
T1: 23,350 (Minor Resistance)
T2: 23,420 (Major Resistance, potential exhaustion point)
Stop-Loss: A tight stop at 23,240.
Bearish Scenario (Price < 23,280):
Entry:A rejection from 23,280 or a firm break below 23,200 suggests a short opportunity.
Targets:
T1: 23,150 (Primary Support)
T2: 23,080 (Secondary Support)
Stop-Loss: A stop placed at 23,320.
Technical Confluence:
RSI (14) on 1H: Hovers around 55, indicating a slight loss of bullish momentum.
EMA (20/50) on 1H: The 20-period EMA is flattening, hinting at a potential crossover with the 50-period EMA, which would be a bearish signal.
Chart Pattern: A potential rising wedge is forming on the 4-hour chart, which often precedes a bearish reversal. A breakdown from the wedge's support line would validate the bearish scenario.
Actionable Plan:
Patience is key. Avoid chasing the price in the current range (23,200-23,280). Wait for a confirmed breakout or breakdown to enter a position. Manage risk accordingly.

Technical Analysis WeeklyGermany 40 is neutral and ranging, with price at 23,843 slightly below the VWAP of 24,026. RSI at 44.2 reflects limited bearish conviction. Support is at 23,610, resistance at 24,410.
Wall Street remains bullish in a pullback phase, with price at 47,217 under the VWAP at 47,439. RSI at 50.6 signals neutral momentum and room for recovery. Support is at 46,823, resistance at 47,919.
UK 100 continues its bullish trend but is in a short-term pullback. Price at 9,689 trades back below the VWAP of 9,743. RSI at 51.2 indicates neutral momentum. Support sits at 9,611, resistance at 9,875.
GBP/USD is still bearish, but is in a pullback phase- bouncing towards the bottom of its former range, trading at 1.3163 on top of its VWAP. RSI at 43.6 hints at mild rebound potential within a broader downtrend. Support lies at 1.3015, resistance at 1.3315.
EUR/USD stays under bearish pressure but is an extended correction with a breaking of downtrend-line and rebound over the VWAP. RSI at 50.3 shows consolidation after prior weakness. Support is at 1.1477, resistance at 1.1677.
USD/JPY holds a bullish bias - pushing into the 155 round number, trading at 154.72 above the VWAP of 153.72. RSI at 63.8 confirms ongoing, yet fading, upward momentum. Support lies at 152.11, resistance at 155.33.
Gold is still undergoing a general correction - forming lower peaks but rising troughs, priced at 4,081 just above the VWAP of 4,039. RSI at 52.7 reflects balanced momentum after strong gains. Support stands at 3,886, resistance at 4,191.
Brent Crude is neutral and range-bound, trading at 6,366 near the VWAP of 6,412. RSI at 48.3 confirms indecision with neither side dominant. Support is at 6,255, resistance at 6,568.
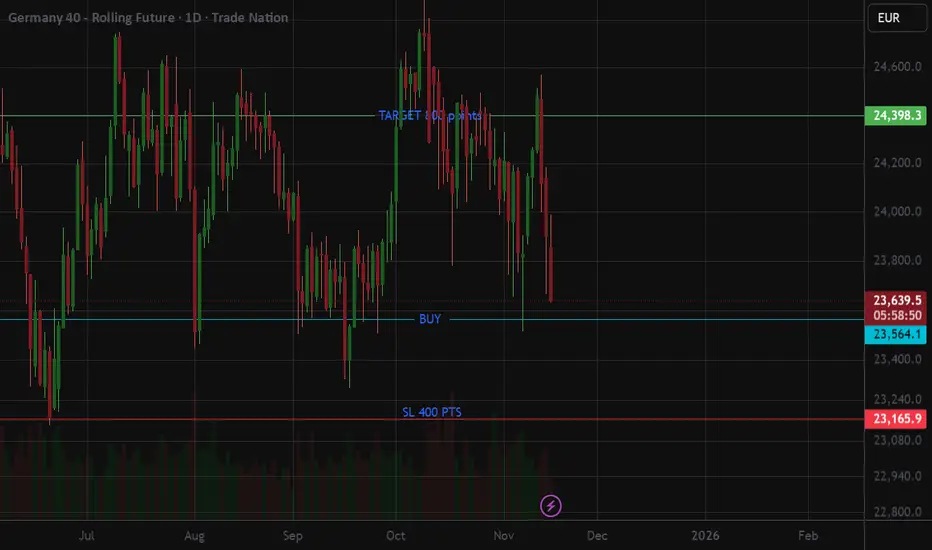
DAX futures buying in bottom of trading range dailya 1:2 RR swing trade in the german index futures (expect to hold this for some days). Risking 400 points, entry by order to gain 800 points. big swing, which means adding to your winner should be possible without increasing your risk! Buy more if the trade is 150 points + in profit and adjust both stop losses on second entry.
Big trading range in DAX, and it is looking bearish this monday.