VET / BTCVeChain forming cup and handle, positioning itself at 98 as a good purchase price and 133 as a sale price.

✳️ Vechain Longterm Double Bottom vs 810% B.Wave (10X Potential)You know what happens if people can't withdraw to fiat?
What happens if it becomes harder to withdraw?
This is a great setup, the Vechain v Bitcoin (VETBTC) chart... Let's do this!
A bottom/low was hit December 2020 followed immediately a 800% bullish wave.
It all started after the September 2019

VET/BTC IdeaJust wanted to publish after years of being away. I keep getting requests on what projects I'm interested in lately. My favorite altcoin for reasons of innovation and a great team that has direction. They are veterans in this space, anyway without further ado...


VET finally ready for LONG?!Flip BTC for VET?!
Looks llke the bottom is in for VET.
VET/BTC-chart indicate upwards next! With some push from BTC and a clean break out I definitely see VET on a potential 80% trade.
It will take some time for the trade to play out.
A breakout from the VET/BTC pair could give VET/USDT some m


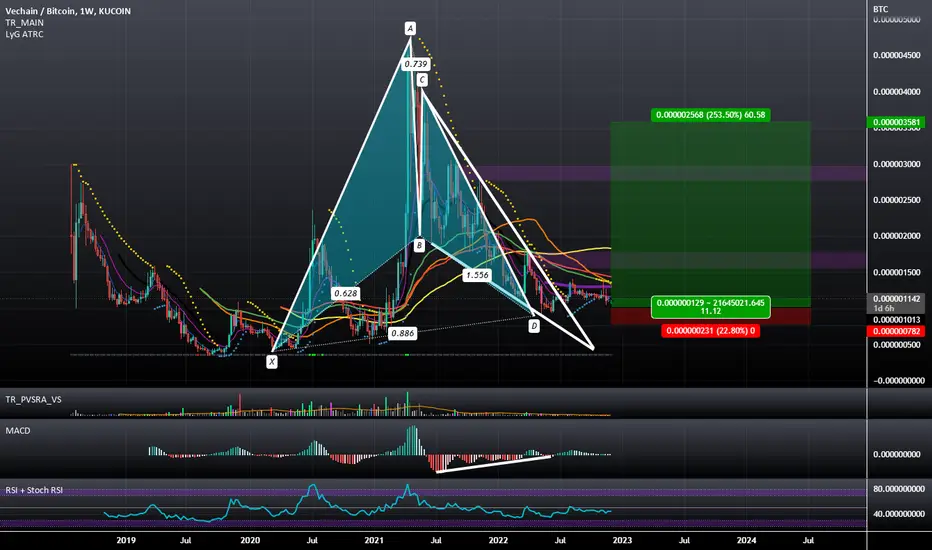
VETBTC: Bullish Divergence Just Below a Bullish Deep Gartley PCZVETBTC has been trading in this Bullish Deep Gartley PCZ area for many weeks now and is currently Bullishly Diverging just below the 1.618-0.886 PCZ Confluence Zone and if this divergence can bring VET back within the zone then I would be looking for it to trade up to four or five thousand sats.

VET BTC Weekly Bullish run RSI around 30
weak momentum
powerful support
Orderblocks
Enter around 70
S.L Under 60
TP = 120 & 160

VET/BTC longVET with BTC pair show us bullish divergence on rsi on daily time frame. I am long in VET

VET/BTC: Bullish Gartley Falling Wedge Breakout on the WeeklyThere is a weekly Bullish Gartley with Bullish Divergence and a Falling Wedge Breakout on the VETBTC pair.
See all ideas