ZEC/USDT | Daily — Bullish SetupZEC/USDT | Daily — Bullish Setup 👀🔥
ZEC is currently retesting the lower boundary of its ascending channel + key demand zone around $1,250–1,330.
Technically, this looks like a support retest inside an established uptrend, not a confirmed reversal yet. A reclaim of $1,400–1,450 would strengthen th
Compare with ZEC/USDT
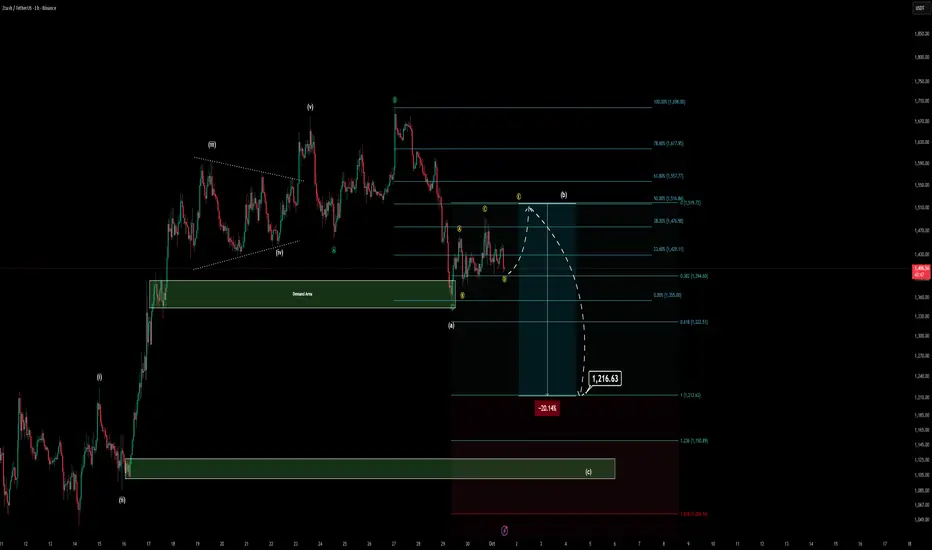
ZEC Rising Wedge Breakdown: Is a Deeper Correction Coming?ZEC is showing a notable shift in structure after breaking below its rising wedge, following a strong expansion into the $1,600+ region. What makes this setup more interesting is the bearish RSI divergence formed at the highs. While price pushed to a higher high, RSI produced a lower high, signallin
ZEC Mini Update (1H)This an update for previous analysis I shared a few days ago.
As we can see in the chart, ABC correction was a flat stucture. This flat structure was only a small Leg of a bigger correction wave which is I believe going to be a Zig-Zag. We can see that this larger wave A is finished and a triangle
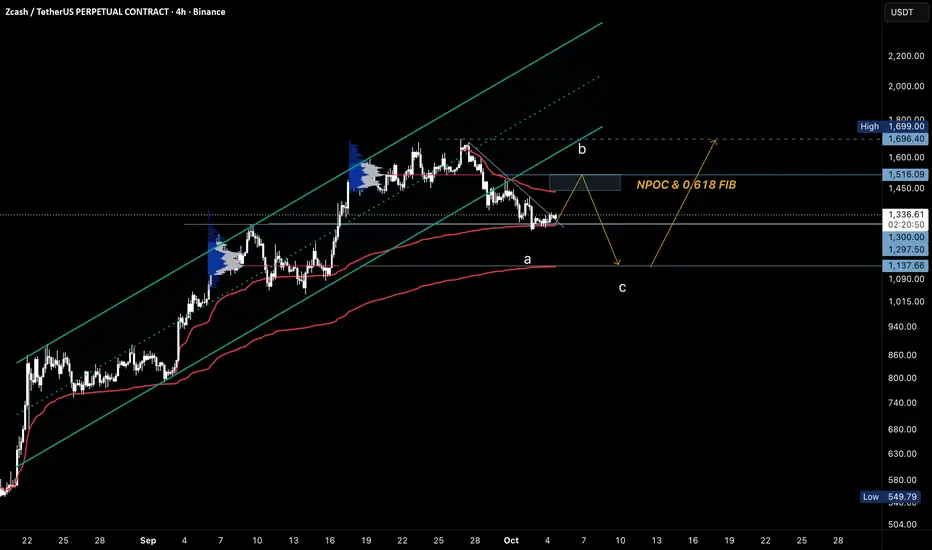
ZEC: One More Dip Before the Next Move?BINANCE:ZECUSDT — 4H Technical Analysis
ZEC is currently undergoing a corrective move after the strong impulsive rally from the lower boundary of the ascending channel.
Price has now reached the **$1,300–$1,335 support area**, which is an important short-term decision zone. The broader structure
ZCASH AT A DECISION POINT — BOUNCE OR BREAK?Yello Paradisers! are #ZCASH bulls about to defend this crucial support zone and trigger another powerful move higher, or is the market preparing to punish impatient buyers first?
💎#ZCASH has now pulled back toward one of the most important areas on the 4H chart. After the strong impulsive rally to
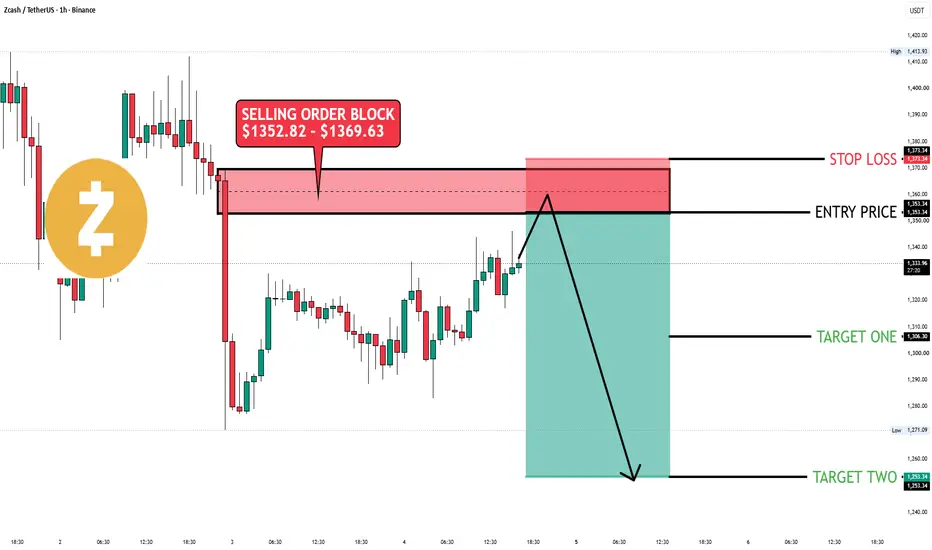
$ZEC | 1H | SELL SETUP |🚨 CRYPTOCAP:ZEC is down ~22% from its ~$1,689 September high. Dip-buyers are lining up. I'm watching the bounce instead.
📊 The narrative: "Rally isn't over. Buy the dip."
What the data shows:
Grayscale's ZEC ETF logged its first net-outflow week since the August launch: $93.56M out
It's the lar
ZECUSDT Update: Expecting a short move from hereBroken from below of the trendline, we could be expecting to see further continuation to the downside.
We have a local resistance around the price of $1,339. We have failed to break from above of it on the first retest.
Our first target relies on the first level of support we will see, because
$ZEC — $1,000 Next? Guys, ZEC is looking pretty interesting here.We’ve already seen 2 strong rejections around the $1,650 area, and now the main uptrend has been broken. Price is struggling to get back above that trendline.
On top of that, Zcash ETF just recorded its first weekly outflow — $93.6M. That adds some press
ZEC ForecastBINANCE:ZECUSDT The logic behind this trade is based on the higher-timeframe bearish trend. The bearish impulses remain strong, while the bullish corrective moves are relatively slow and weak.
On the lower timeframe, we can also see a strong bearish move followed by a slow bullish correction, which
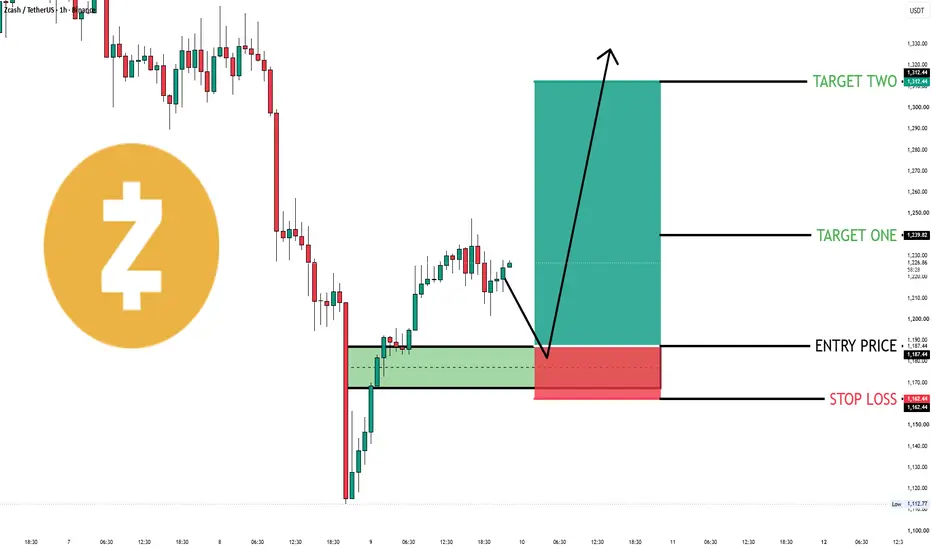
$ZEC | 1H | BUY SETUP |🚨 BINANCE:ZECUSDT has no unlock to blame. ~80% of the 21M supply is already out. This dump is about flows, not supply.
📊 Chart (1H, Binance):
Price: $1,225.39
Low: $1,112.77
That’s a ~10% bounce off the low.
Late-Sept high was ~$1,600+. From there to the low is ~30%.
The narrative: “Privacy ral
See all ideas
Summarizing what the indicators are suggesting.
Oscillators
Neutral
Oscillators
Neutral
Summary
Neutral
Summary
Neutral
Summary
Neutral
Moving Averages
Neutral
Moving Averages
Neutral
Displays a symbol's price movements over previous years to identify recurring trends.
Frequently asked questions
The current price of Zcash/USDT (ZEC) is 1,268.10 USDT — it has risen 1.35% in the past 24 hours. Try placing this info into the context by checking out what coins are also gaining and losing at the moment and seeing ZEC price chart.
Zcash/USDT price has fallen by −6.10% over the last week, its month performance shows a −1.76% decrease, and as for the last year, Zcash/USDT has increased by 4.96 K%. See more dynamics on ZEC price chart.
Keep track of coins' changes with our Crypto Coins Heatmap.
Zcash/USDT (ZEC) reached its highest price on Sep 26, 2026 — it amounted to 1,697.45 USDT. Find more insights on the ZEC price chart.
See the list of crypto gainers and choose what best fits your strategy.
Zcash/USDT (ZEC) reached the lowest price of 17.20 USDT on Mar 13, 2020. View more Zcash/USDT dynamics on the price chart.
See the list of crypto losers to find unexpected opportunities.
The safest choice when buying ZEC is to go to a well-known crypto exchange. Some of the popular names are Binance, Coinbase, Kraken. But you'll have to find a reliable broker and create an account first. You can trade ZEC right from TradingView charts — just choose a broker and connect to your account.
Crypto markets are famous for their volatility, so one should study all the available stats before adding crypto assets to their portfolio. Very often it's technical analysis that comes in handy. We prepared technical ratings for Zcash/USDT (ZEC): today its technical analysis shows the neutral signal, and according to the 1 week rating ZEC shows the buy signal. And you'd better dig deeper and study 1 month rating too — it's buy. Find inspiration in Zcash/USDT trading ideas and keep track of what's moving crypto markets with our crypto news feed.
Zcash/USDT (ZEC) is just as reliable as any other crypto asset — this corner of the world market is highly volatile. Today, for instance, Zcash/USDT is estimated as 6.62% volatile. The only thing it means is that you must prepare and examine all available information before making a decision.
You can discuss Zcash/USDT (ZEC) with other users in our public chats, Minds or in the comments to Ideas.