Oracle - The worst drawdown ever!💣Oracle ( NYSE:ORCL ) will ends its bearmarket soon:
🔎Analysis summary:
Over the past five months, Oracle has been correcting more than -60%. And while we can clearly witness a major selloff, Oracle is also approaching a major support area. And if we see bullish confirmation in the near futur

The best trades require research, then commitment.
Get started for free$0 forever, no credit card needed

Scott "Kidd" PoteetPolaris Dawn astronaut

Where the world does markets
Join 100 million traders and investors taking the future into their own hands.

FTSE100 Breakout supported at previous consolidation zoneThe FTSE remains in a bullish trend, with recent price action showing signs of a breakout within the broader uptrend.
Support Zone: 10340 – a key level from previous consolidation. Price is currently testing or approaching this level.
A bullish rebound from 9490 would confirm ongoing upside moment

MNQ Daily Analysis - Tuesday February 3 2026 part 1As a learning, beginner day trader I go through the market replay predefining what I am looking for to enter a trade and walk through my thoughts as I experience the market action bar by bar throughout the entire day to see how I handle various events and assess my execution.
This is for me and oth

BITCOIN and the powerful Stoch RSI Cycle SignalThe Stoch RSI is a very rarely used indicator, in fact the last time we made use of it on Bitcoin (BTCUSD) was around the bottom of the 2022 Bear Cycle. We bring it forward to you once more as December closed with the 1M Stoch RSI below the 20.00 level. Historically, every time the market did that,

GBPNZD - Two Magnets, Two Clear JobsGBPNZD is trading between two zones that keep acting like magnets:
On the upside, the red structure has been attracting price again and again. Every time price reaches that area, sellers show up. As long as that structure holds, that’s where I’ll be looking for shorts.📉
On the downside , the bl

Intuit and Netflix. The Danger of Broken TrendsIntuit and Netflix. The Danger of Broken Trends
Momentum is the most powerful force in physics and finance but when an object in motion suddenly stops the impact is catastrophic. We often assume trends last forever yet the moment a multi year structure fractures it triggers a violent repricing e

Bitcoin - Last drop, then a huge pump! (watch this wedge)Bitcoin is currently trading at around 78,000 at the time of writing this article, and I expect the price to go down to 71k - 72k in the short term. Why? As we can see on the chart, there are many reasons why Bitcoin should go down. The first reason is that whales (banks, institutions) still didn't

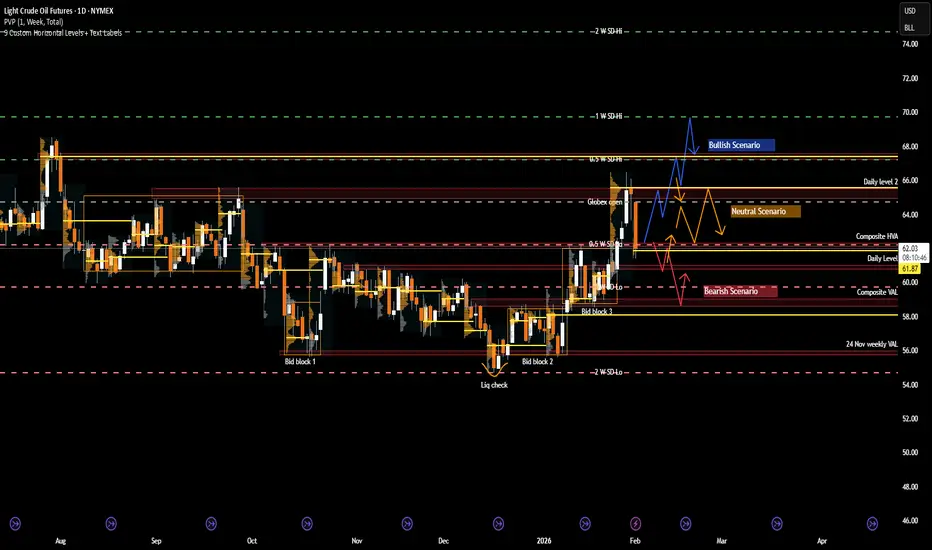
CL: Crude Oil at a Crossroads as Geopolitics Meet Key LevelsRecent Sentiment and Key Headlines Driving Crude
Crude oil sentiment over recent weeks has been shaped by a renewed mix of geopolitical risk and shifting expectations around global supply discipline. Headlines tied to Venezuela and Iran have been particularly influential, adding a layer of risk pr
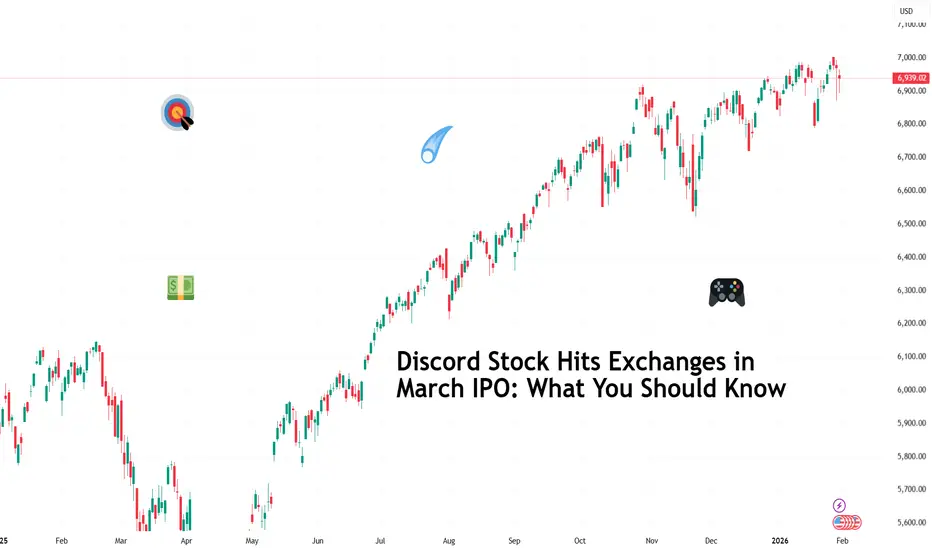
Discord Stock Hits Exchanges in March IPO: What You Should KnowDiscord NASDAQ:DISCORD has filed confidential IPO paperwork with the SEC and is aiming for a March debut (ref: the IPO calendar ), reigniting speculation around one of Silicon Valley’s most closely watched private companies.
The late-stage startup has lined up heavyweight underwriters Goldman Sa
AUD/USD – H1 - Head & Shoulders BreakdownAUD/USD has printed a clean Head & Shoulders pattern on the H1 timeframe , signaling a potential trend reversal after a strong bullish run. Price has now broken below the neckline, confirming bearish momentum and opening the door for a deeper correction. OANDA:AUDUSD
🔍 Technical Analysis
🧠 Cla

See all editors' picks ideas
Smart Trader, Episode 03, by Ata Sabanci, Candles and TradelinesA volume-based multi-block analysis system designed for educational purposes. This indicator helps traders understand their current market situation through aggregated block analysis, volumetric calculations, trend detection, and an AI-style narrative engine.
━━━━━━━━━━━━━━━━━━━━━━━━━━━━━━━━━━━━━━━

Asset Drift ModelThis Asset Drift Model is a statistical tool designed to detect whether an asset exhibits a systematic directional tendency in its historical returns. Unlike traditional momentum indicators that react to price movements, this indicator performs a formal hypothesis test to determine if the observed d

Hyperfork Matrix🔱 Hyperfork Matrix 🔱 A manual Andrews Pitchfork tool with action/reaction propagation lines and lattice matrix functionality. This indicator extends Dr. Alan Andrews' and Patrick Mikula's median line methodology by automating the projection of reaction and action lines at equidistant intervals, cr

Arbitrage Matrix [LuxAlgo]The Arbitrage Matrix is a follow-up to our Arbitrage Detector that compares the spreads in price and volume between all the major crypto exchanges and forex brokers for any given asset.
It provides traders with a comprehensive view of the entire marketplace, revealing hidden relationships among d

Wyckoff Schematic by Kingshuk GhoshThe "Wyckoff Schematic" is a Pine Script indicator that automatically detects and visualizes Wyckoff Method accumulation and distribution patterns in real-time. This professional tool helps traders identify smart money movements, phase transitions, and critical market structure points.
Key Features

Volume Cluster Profile [VCP] (Zeiierman)█ Overview
Volume Cluster Profile (Zeiierman) is a volume profile tool that builds cluster-enhanced volume-by-price maps for both the current market window and prior swing segments.
Instead of treating the profile as a raw histogram only, VCP detects the dominant volume peaks (clusters) insid

DeeptestDeeptest: Quantitative Backtesting Library for Pine Script
━━━━━━━━━━━━━━━━━━━━━━━━━━━━━━━━━━
█ OVERVIEW
Deeptest is a Pine Script library that provides quantitative analysis tools for strategy backtesting. It calculates over 100 statistical metrics including risk-adjusted return ratios (Sharpe

Arbitrage Detector [LuxAlgo]The Arbitrage Detector unveils hidden spreads in the crypto and forex markets. It compares the same asset on the main crypto exchanges and forex brokers and displays both prices and volumes on a dashboard, as well as the maximum spread detected on a histogram divided by four user-selected percenti

Multi-Distribution Volume Profile (Zeiierman)█ Overview
Multi-Distribution Volume Profile (Zeiierman) is a flexible, structure-first volume profile tool that lets you reshape how volume is distributed across price, from classic uniform profiles to advanced statistical curves like Gaussian, Lognormal, Student-t, and more.
Instead of forcin

Multi-Ticker Anchored CandlesMulti-Ticker Anchored Candles (MTAC) is a simple tool for overlaying up to 3 tickers onto the same chart. This is achieved by interpreting each symbol's OHLC data as percentages, then plotting their candle points relative to the main chart's open. This allows for a simple comparison of tickers to tr

See all indicators and strategies
Community trends
Oracle - The worst drawdown ever!💣Oracle ( NYSE:ORCL ) will ends its bearmarket soon:
🔎Analysis summary:
Over the past five months, Oracle has been correcting more than -60%. And while we can clearly witness a major selloff, Oracle is also approaching a major support area. And if we see bullish confirmation in the near futur
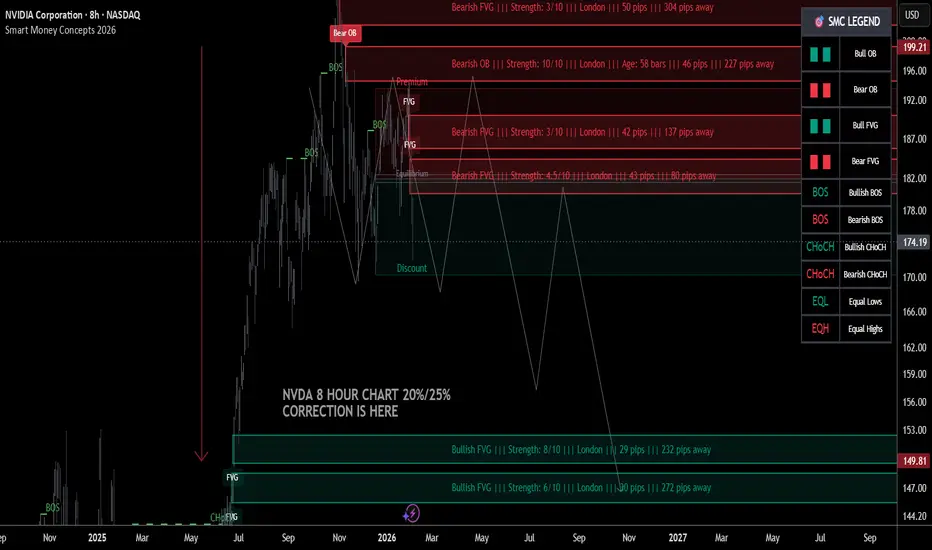
NVDA 25% correction is finally here🔱 NVDA WEEKLY SNAPSHOT — EXECUTIVE SUMMARY
🧨 Bears remain in control as price action continues to respect overhead supply, with rallies viewed as distribution opportunities
🔻 Key sell zones: 196 bearish Order Block + 186 / 182 bearish FVGs — rips into these areas are for selling
🎯 Primary downside
Gamestop: Got To Love ItWell hasn't the narrative changed around GME
I've been WRONG and MORE WRONG about almost everything regarding pure timing with this one
But what I havent been wrong about is the fact that I said all last year that GME would hold that 20-22 region
What Im also not wrong on is the fact that there i

PayPal ($PYPL) – Macro Double Bottom (Monthly Timeframe)hi traders
This technical analysis evaluates the long-term price action of PayPal ( NASDAQ:PYPL ), identifying a high-conviction reversal setup as the stock tests historical support levels.
1. Technical Setup: The Double Bottom
The most significant development on the monthly chart is the formatio

Is NOW the time to DCA?Enterprise software is getting smoked. We are experiencing an epic multiple compression in the entire sector. Now is the time to start looking at the best in breed companies, let me draw your attention to the best in the business - Service Now.
With an 84.5% subscription gross margin and 98% renewa

AMZN Wait For The Crack!This is a complete structure with 4 points, 3 waves, and a hook revealing a rising wedge.
The first mini-crack has already taken place.
The structure is all set up, valid, and ready to crack! All you have to do is wait.
🚨CAUTION! To all the bulls!
If you enjoy the work:
👉 Boost
👉 Follow
👉 Drop a

Oracle (ORCL) Shares Fall Below $150Oracle (ORCL) Shares Fall Below $150
The start of February has been negative for technology stocks, weighed down by a wave of pessimism driven by several factors, including:
→ “AI spending fatigue.” Results from Microsoft and Alphabet highlighted massive capital expenditure (CapEx). Tens of billi

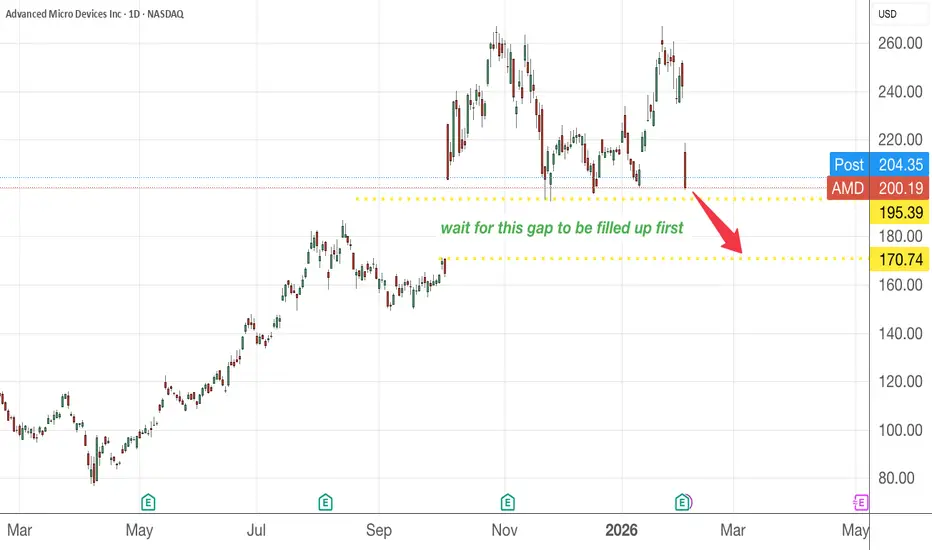
AMD is offering discount , are you buying ?I will take a bet for the gap to be filled up before buying more. The current Tech sector sells off may be an opportunity for us to bring along great companies like this to slide further, meaning more discount coming your way....
Please DYODD
Google Short - Target $312Hello Traders,
After the recent impulsive move up into the 349–350 area and subsequent displacement lower, price is now retracing back into a prior supply / inefficiency zone between 338–342.
This zone aligns with:
Previous intraday structure (LH area)
Local imbalance
Premium range within current

When I was heavily shorting $PLTR close to $200 many people wereWhen I was heavily shorting NASDAQ:PLTR close to $200 many people were telling me I had low IQ because I had no understanding about the company. I have not received a DM or reply for many weeks about Palantir.
They are all silent now. Palantir to double digits!

See all stocks ideas
Today
PRLBProto Labs, Inc.
Actual
—
Estimate
0.35
USD
Today
CNCCentene Corporation
Actual
—
Estimate
−1.22
USD
Today
EAFGrafTech International Ltd.
Actual
—
Estimate
−1.25
USD
Today
MPXMarine Products Corporation
Actual
—
Estimate
0.10
USD
Today
UAUnder Armour, Inc.
Actual
—
Estimate
−0.02
USD
Today
MGMMGM Resorts International
Actual
1.60
USD
Estimate
1.60
USD
Today
VRTSVirtus Investment Partners, Inc.
Actual
—
Estimate
6.45
USD
Today
EVIEVI Industries, Inc.
Actual
—
Estimate
0.16
USD
See more events
Community trends
Bitcoin to $90k - February 2026Remember those dizzy heights seven days ago?
** The weeks ahead, void after May 2026 **
You read correctly, Without-worries has a bullish idea. For most of quarter 4, 2025 it has been a stream of bearish ideas, mostly all falling on deaf ears. Today is a bullish idea. A bullish idea with a time l

BTCUSDT: Fake Breakout From Support Signals Potential Long SetupHello everyone, here is my breakdown of the current BTCUSDT setup.
Market Analysis
BTCUSDT previously traded within a large symmetrical triangle, where price was gradually compressing between the triangle resistance and support lines. This phase reflected market indecision and liquidity buildup,

Bitcoin - Last drop, then a huge pump! (watch this wedge)Bitcoin is currently trading at around 78,000 at the time of writing this article, and I expect the price to go down to 71k - 72k in the short term. Why? As we can see on the chart, there are many reasons why Bitcoin should go down. The first reason is that whales (banks, institutions) still didn't
BTC - Ultimate Swing Short Update - Next Stop 8,000Update on my BTC Ultimate Swing Short Plan:
Take Profits 1, 2 hit
Take Profit 3 approaching
Next Movement:
Straight to 8,000
No longer anticipating 3 wave corrective pattern
Happy Trading
- DD

Bitcoin Weekly Roadmap: 50_SMA(Weekly) Lost — $70K Break Next?Let’s start with my previous weekly analysis on Bitcoin from Jul 11, 2025 , which showed that when higher timeframe technical analysis is done right, it can be impactful and help capture key trends. Back then, we identified the All-Time High(ATH=$126,199) and the subsequent correction accurately.

BTC May Be in Free Fall With Low MomentumBTC May Be in Free Fall With Low Momentum
From our previous analysis, BTC transformed with clear bullish and bearish patterns, but only respected the daily pattern
The price started a downtrend from the moment the bearish flag appeared, as I showed in the video.
BTC has already broken out of two

Bitcoin - Sweep, Reclaim, Then Continuation Lower?Higher Timeframe Context
Price continues to respect a broader bearish structure, with lower highs forming after the previous distribution phase. The recent downside expansion did not occur randomly, it aligned with higher timeframe weakness and persistent sell-side pressure. Even though support has

Bearish Descending Channel with Continuation Setup
This is a BTC/USD 1-hour chart showing a clear downtrend inside a descending channel. Price has been making lower highs and lower lows, respecting the channel boundaries. The Ichimoku Cloud is mostly above price, acting as dynamic resistance, which confirms bearish momentum. A BOS (Break of Structu

Eliana | BTCUSD – 30M – Intraday Market ConditionBITSTAMP:BTCUSD COINBASE:BTCUSD
After distribution near the 79,000–78,000 resistance range, BTC experienced a strong impulsive sell-off, confirming bearish dominance. The breakdown below 73,000 accelerated momentum toward the 69,000 liquidity pocket. Current bounce appears corrective rather than

Vitalik Just Killed the "L2 Narrative."The market is missing the biggest pivot in Ethereum history.
For the last two years, the "Smart Money" trade was to Long L2s and Short L1. That trade ended this week.
On February 3, Ethereum co-founder Vitalik Buterin published a seminal critique declaring that the "Rollup-Centric Roadmap" (L2s ac

See all crypto ideas
Gold 30-Min — Volume Buy & Sell Reversal Triggered⚡Base : Hanzo Trading Alpha Algorithm
The algorithm calculates volatility displacement vs liquidity recovery, identifying where probability meets imbalance.
It trades only where precision, volume, and manipulation intersect —only logic.
✈️ Technical Reasons
/ Direction — LONG / Reversal 4760 Area

Selena | XAUUSD – 1H – Short-Term Corrective StructurePEPPERSTONE:XAUUSD FOREXCOM:XAUUSD
Following the strong sell-off from the highs, XAUUSD formed a base near the 4400 liquidity zone, triggering a corrective bullish move. Price is now moving in a rising channel but remains below the higher-timeframe resistance and prior supply. As long as price

Elise | XAUUSD – 30M – Bullish Continuation SetupOANDA:XAUUSD
After the impulsive sell-off, XAUUSD shifted into a recovery phase with steady bullish candles. The current pullback into demand is corrective, not impulsive, which supports the idea of continuation higher. Buyers are defending this zone aggressively, and a bullish reaction here opens

Gold Holds Demand - Long Scenario After Correction Toward $5,180Hello traders! Here’s my technical outlook on XAUUSD (1H) based on the current chart structure. Gold initially traded within a well-defined range, indicating a period of accumulation and market balance. This consolidation eventually resolved to the upside, leading to a strong impulsive move and conf

Is the Rally Just for Selling? A Bearish Scenario for XAGUSDXAGUSD is currently showing that a short-term bearish trend is clearly dominating, as both news-driven factors and technical structure fail to support a sustainable bullish reversal. The broader macro backdrop continues to favor the U.S. dollar, with U.S. Treasury yields remaining elevated and ex

GOLD: Latest update 04/02/2026! Dear traders,
Our last update on gold has been successful and we’re currently up over 1968 pips. This presents a good opportunity for you all to consider a second entry as the price has corrected. It’s possible the price will reverse from the area we’ve highlighted. Please remember to manage you

Gold Price Analysis – Key Resistance and Support LevelsThis chart outlines critical resistance and support levels for gold prices. The Key Resistance Level at 5,565.814 is a potential area for price rejection or breakout. If price approaches this level, watch for either a continuation of bullish momentum or a pause in upward movement. The Support Zone a

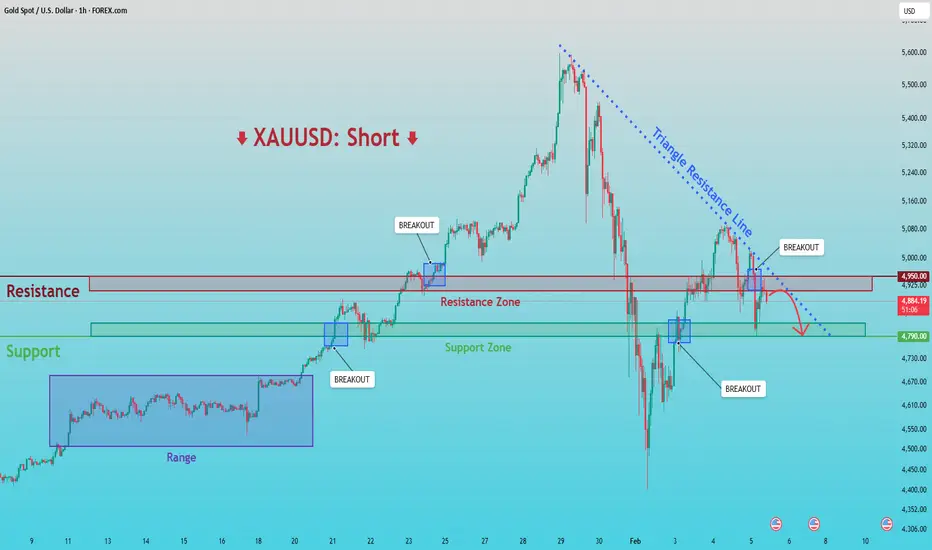
XAUUSD: Breakdown & Retest Signals Bearish ContinuationHello everyone, here is my breakdown of the current XAUUSD setup.
Market Analysis
XAUUSD previously traded within a well-defined consolidation range, where price moved sideways for an extended period, indicating balance between buyers and sellers and gradual liquidity accumulation. This range eve
XAUUSD (Gold) – 30M Price Action & Key LevelsGold is trading within a corrective phase after breaking below the ascending channel. Price is currently reacting from a well-defined support zone, while the overall structure suggests bullish continuation if this support holds. A sustained move above the resistance zone may confirm strength and ope

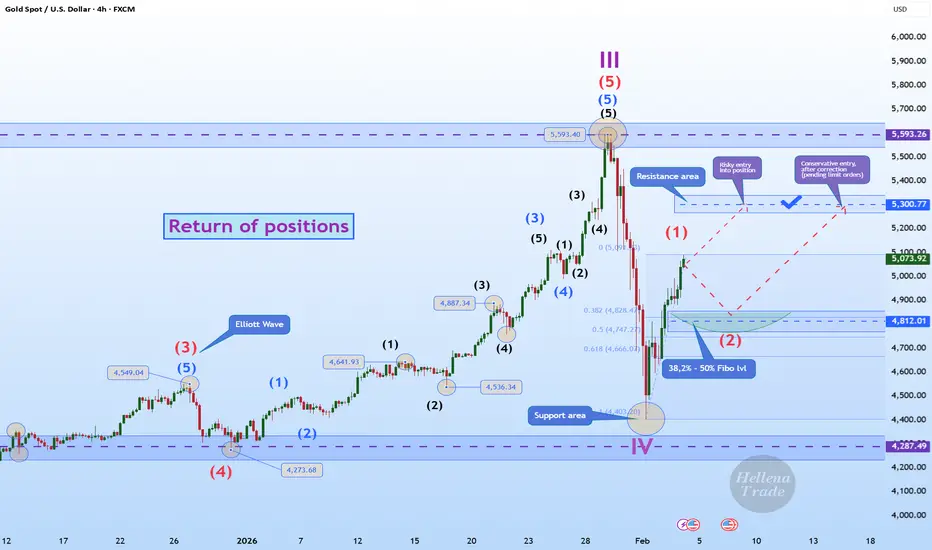
Hellena | GOLD (4H): LONG to 5300 area (Wave 3).Colleagues, the price has shown a positive upward trend, and I believe that wave “1” is either complete and wave ‘2’ correction will begin, or wave “1” will be extended.
In any case, I expect the price to reach 5300 as the nearest target. This movement after the correction will confirm the structure
See all futures ideas
GBPUSD 3M CLS - Daily OB Confirmed More Downside comingHi friends, new 3M range created and confirmed. As always we are looking for the manipulation in to the key level around the range. Don't forget confirmation switch from manipulation phase to the distribution phase to make the setup valid. Stay patient and enter only after change in order flow. If

EURUSD Long: Demand Zone Holds - Bulls Preparing Next LegHello traders! Here’s a clear technical breakdown of EURUSD (2H) based on the current chart structure. EURUSD previously traded within a well-defined descending channel, where price consistently respected the descending resistance and support lines, forming a series of lower highs and lower lows. Th
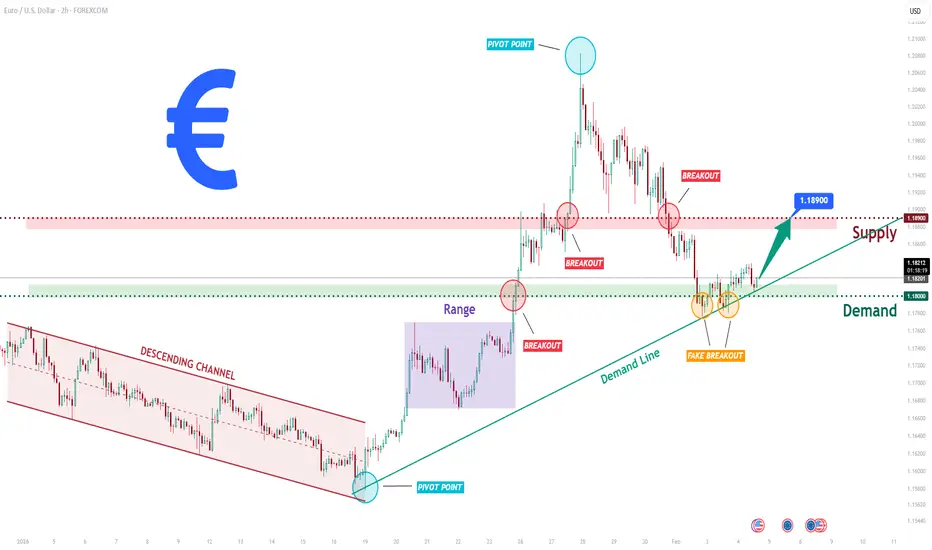
EURUSD Bullish Recovery After Healthy Correction, Target 1.1870Hello traders! Here’s my technical outlook on EURUSD (4H) based on the current chart structure. EURUSD previously traded within a mixed structure that transitioned from a broader corrective phase into a clear bullish recovery. After forming a base near the rising higher-timeframe trend line, price b

TheGrove | USDJPY Buy | Idea Trading AnalysisEURJPY is moving on Resistance AREA..
The chart is above the support area, which has already become a reversal point twice.
We expect a decline in the channel after testing the current level and moving to resistance line
We expect a decline in the channel after testing the current level
Hello Trade

NZDJPY: Breaking Out of Ascending TriangleNZDJPY: Breaking Out of Ascending Triangle
NZDJPY has broken out of a contracting triangle on the H4 timeframe, confirming the uptrend.
The price has respected the uptrend and is now pushing above the pattern in a clear way, signaling strong buying momentum.
As long as the structure holds, upsid

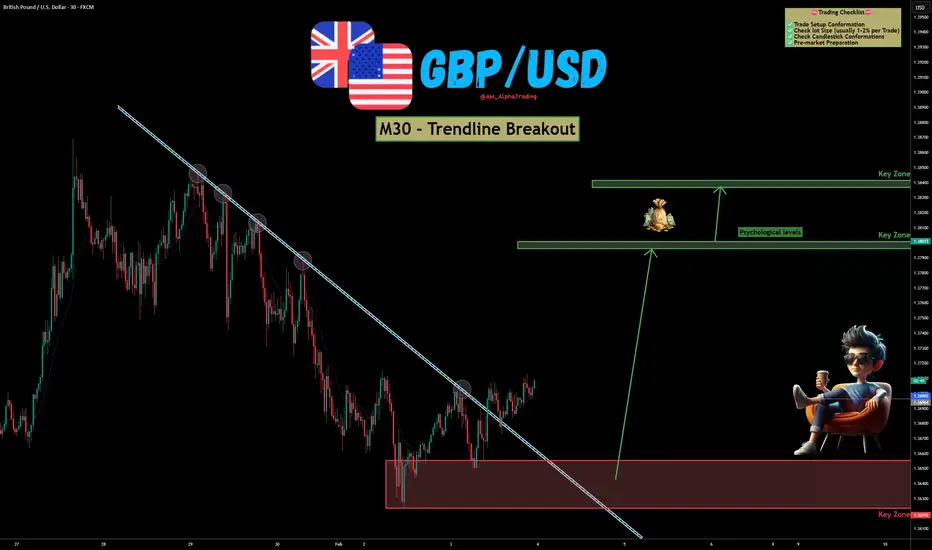
GBP/USD – Trendline Breakout | Bullish Reversal SetupGBP/USD has shown a clear breakout above a well-respected descending trendline on the M30 timeframe, hinting at a potential shift from bearish to bullish momentum. Price action is reacting strongly from a key demand zone, increasing the probability of continuation to the upside. OANDA:GBPUSD
📊
EURUSD Additional Supply Reaction ZoneQuick Summary
Besides the previously mentioned point of interest EURUSD may also react from 1.18422
This level represents a strong supply zone
An inducement area sits just below which could allow a liquidity sweep before continuation
Given the strong bearish momentum price may also ignore this zone

05.02.26 Daily ForecastPairs on Watch -
FX:EURUSD
FX:GBPUSD
FX:NZDUSD
A short overview of the instruments I am looking at for today, multi-timeframe analysis down to what I will be looking at for an entry. Enjoy!

USDJPY 30Min Engaged ( Bearish Reversal Entry Detected )⚡Base : Hanzo Trading Alpha Algorithm
The algorithm calculates volatility displacement vs liquidity recovery, identifying where probability meets imbalance.
It trades only where precision, volume, and manipulation intersect —only logic.
✈️ Technical Reasons
/ Direction — SHORT / Reversal 156.640 Ar

GBPUSD H4: Correction Before the Next Bullish ExpansionHi!
GBPUSD is currently transitioning into a short-term corrective phase after showing signs of trend exhaustion near the upper boundary of the ascending channel. Following the strong impulsive rally, price failed to sustain momentum at the channel top and has since reacted lower, signaling that bu

See all forex ideas
Trade directly on Supercharts through our supported, fully-verified, and user-reviewed brokers.


